
NOAA, National Weather Service
Colorado Basin River Forecast Center
Salt Lake City, Utah
www.cbrfc.noaa.gov
| Prepared by Brent Bernard NOAA, National Weather Service Colorado Basin River Forecast Center Salt Lake City, Utah www.cbrfc.noaa.gov |
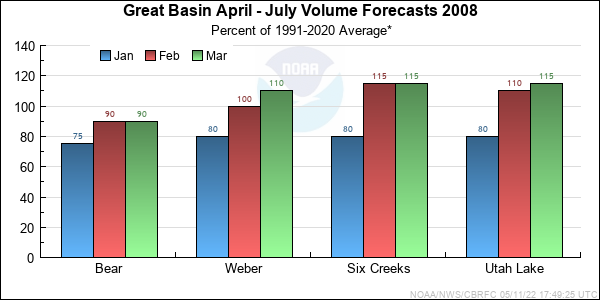
| Forecast Period | 90% Exceedance Volume | 50% Exceedance Volume | Percent Average | 10% Exceedance Volume | |
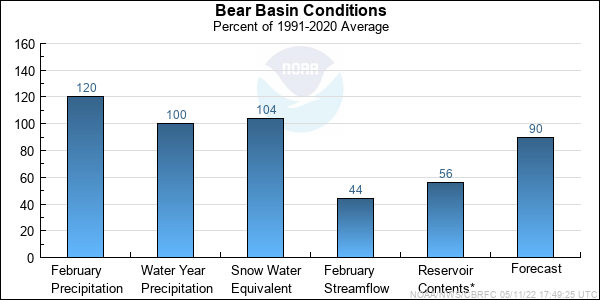
| Bear | |||||
| Utah | April-July | 88 | 125 | 111 | 162 |
| Woodruff Narrows Res | April-July | 75 | 145 | 107 | 215 |
| Big Ck | |||||
| Randolph, Nr | April-July | 1.1 | 4.7 | 96 | 8.3 |
| Smiths Fork | |||||
| Border, Nr | April-July | 59 | 88 | 85 | 117 |
| Bear | |||||
| Montpelier, Nr, Stewart Dam, Blo | April-July | 65 | 160 | 68 | 255 |
| Logan | |||||
| Logan, Nr, State Dam, Abv | April-July | 78 | 112 | 89 | 146 |
| Blacksmith Fork | |||||
| Hyrum, Nr, Upnl Dam, Abv | April-July | 24 | 48 | 100 | 72 |
| Forecast Period | 90% Exceedance Volume | 50% Exceedance Volume | Percent Average | 10% Exceedance Volume | |
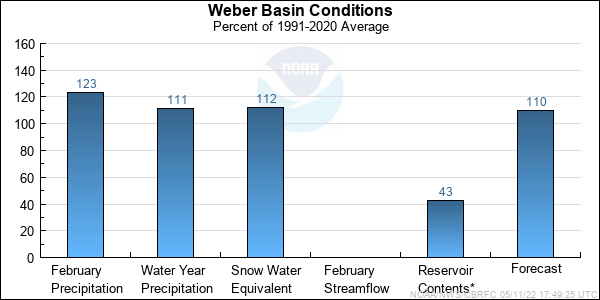
| Weber | |||||
| Oakley, Nr | April-July | 102 | 132 | 107 | 168 |
| Rockport Res, Wanship, Nr | April-July | 78 | 148 | 110 | 186 |
| Coalville, Nr | April-July | 105 | 150 | 109 | 195 |
| Chalk Ck | |||||
| Coalville | April-July | 21 | 45 | 100 | 74 |
| Weber | |||||
| Echo Res, Echo, At | April-July | 125 | 196 | 109 | 265 |
| Lost Ck | |||||
| Lost Ck Res, Croydon, Nr | April-July | 3.1 | 18 | 102 | 33 |
| East Canyon Ck | |||||
| East Canyon Res, Morgan, Nr | April-July | 19.8 | 36 | 116 | 52 |
| Weber | |||||
| Gateway | April-July | 220 | 390 | 110 | 560 |
| Sf Ogden | |||||
| Huntsville, Nr | April-July | 39 | 64 | 100 | 89 |
| Ogden | |||||
| Pineview Res, Ogden, Nr | April-July | 89 | 145 | 109 | 200 |
| Wheeler Ck | |||||
| Huntsville, Nr | April-July | 4.9 | 6.8 | 108 | 8.7 |
| Forecast Period | 90% Exceedance Volume | 50% Exceedance Volume | Percent Average | 10% Exceedance Volume | |
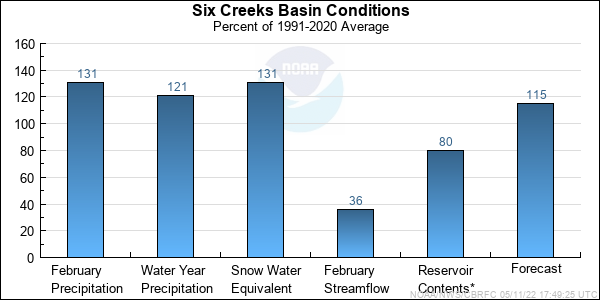
| Little Cottonwood Ck | |||||
| Salt Lake City, Nr | April-July | 34 | 45 | 113 | 56 |
| Big Cottonwood Ck | |||||
| Salt Lake City, Nr | April-July | 31 | 43 | 113 | 55 |
| Mill Ck | |||||
| Salt Lake City, Nr | April-July | 5.1 | 8.3 | 119 | 11.5 |
| Dell Fk | |||||
| Little Dell Res | April-July | 3.7 | 7.7 | 113 | 11.7 |
| Parleys Ck | |||||
| Salt Lake City, Nr | April-July | 10.2 | 19.8 | 119 | 29 |
| Emigration Ck | |||||
| Salt Lake City, Nr | April-July | 1.9 | 5.4 | 120 | 8.9 |
| City Ck | |||||
| Salt Lake City, Nr | April-July | 5.7 | 10.3 | 118 | 14.9 |
| Vernon Ck | |||||
| Vernon, Nr | April-June | 0.81 | 1.7 | 115 | 2.6 |
| S Willow Ck | |||||
| Grantsville, Nr | April-July | 1.5 | 3.7 | 116 | 6 |
| Forecast Period | 90% Exceedance Volume | 50% Exceedance Volume | Percent Average | 10% Exceedance Volume | |
| Spanish Fork | |||||
| Castilla, Nr | April-July | 35 | 85 | 110 | 135 |
| Provo | |||||
| Woodland, Nr | April-July | 84 | 113 | 110 | 142 |
| Hailstone, Nr | April-July | 82 | 120 | 110 | 158 |
| Deer Ck Res | April-July | 74 | 135 | 107 | 196 |
| American Fork | |||||
| American Fork, Nr, Up Pwrplnt, Abv | April-July | 22 | 35 | 109 | 48 |
| Jordan | |||||
| Utah Lake, Provo, Nr | April-July | 167 | 370 | 114 | 575 |
| Range | Round to | |
| 0-1.99 | 0.01 | |
| 2.0-19.9 | 0.1 | |
| 20-199 | 1.0 | |
| 200-999 | 5.0 | |
| 1000+ | 3 significant digits |

