NOAA, National Weather Service
Colorado Basin River Forecast Center
Salt Lake City, Utah
www.cbrfc.noaa.gov
| Prepared by Brent.Bernard, Patrick Kormos NOAA, National Weather Service Colorado Basin River Forecast Center Salt Lake City, Utah www.cbrfc.noaa.gov |

| Forecast Period | 90% Exceedance Volume | 70% Exceedance Volume | 50% Exceedance Volume | Percent Average | 30% Exceedance Volume | 10% Exceedance Volume | |
| Bear | |||||||
| Utah | April-July | 97 | 112 | 122 | 109 | 143 | 159 |
| Woodruff Narrows Rsvr, Abv | April-July | 85 | 104 | 121 | 100 | 143 | 189 |
| Montpelier, Nr, Stewart Dam, Blo * | April-July | 76 | 99 | 114 | 63 | 174 | 275 |
| Smiths Fork | |||||||
| Border, Nr | April-July | 57 | 61 | 76 | 85 | 81 | 96 |
| Logan | |||||||
| Logan, Nr, State Dam, Abv | April-July | 82 | 92 | 101 | 91 | 116 | 138 |
| Blacksmith Fork | |||||||
| Hyrum, Nr, Upnl Dam, Abv | April-July | 33 | 40 | 47 | 109 | 62 | 69 |
| Little Bear | |||||||
| Paradise | April-July | 25 | 39 | 45 | 96 | 59 | 70 |
| Forecast Period | 90% Exceedance Volume | 70% Exceedance Volume | 50% Exceedance Volume | Percent Average | 30% Exceedance Volume | 10% Exceedance Volume | |
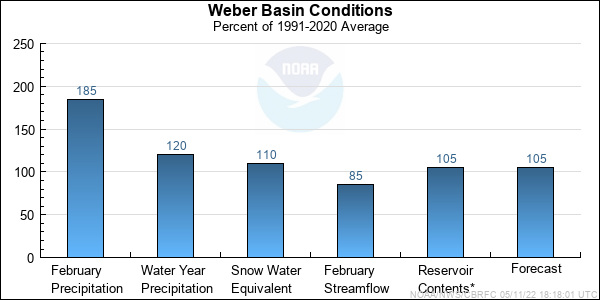
| Weber | |||||||
| Oakley, Nr | April-July | 87 | 95 | 122 | 103 | 138 | 156 |
| Rockport Res, Wanship, Nr | April-July | 91 | 102 | 136 | 103 | 161 | 184 |
| Coalville, Nr | April-July | 89 | 102 | 141 | 105 | 168 | 192 |
| Chalk Ck | |||||||
| Coalville | April-July | 24 | 36 | 45 | 110 | 61 | 80 |
| Weber | |||||||
| Echo Res, Echo, At | April-July | 107 | 137 | 178 | 104 | 230 | 275 |
| Lost Ck | |||||||
| Lost Ck Res, Croydon, Nr | April-July | 8 | 10.7 | 14.3 | 107 | 17.7 | 19.9 |
| East Canyon Ck | |||||||
| East Canyon Res, Morgan, Nr | April-July | 19 | 25 | 33 | 122 | 42 | 49 |
| Weber | |||||||
| Gateway | April-July | 215 | 260 | 325 | 100 | 455 | 540 |
| Sf Ogden | |||||||
| Huntsville, Nr | April-July | 49 | 64 | 78 | 139 | 93 | 104 |
| Ogden | |||||||
| Pineview Res, Ogden, Nr | April-July | 98 | 117 | 148 | 131 | 184 | 210 |
| Forecast Period | 90% Exceedance Volume | 70% Exceedance Volume | 50% Exceedance Volume | Percent Average | 30% Exceedance Volume | 10% Exceedance Volume | |
| Little Cottonwood Ck | |||||||
| Salt Lake City, Nr | April-July | 35 | 39 | 46 | 121 | 48 | 52 |
| Big Cottonwood Ck | |||||||
| Salt Lake City, Nr | April-July | 30 | 37 | 42 | 117 | 47 | 53 |
| Mill Ck | |||||||
| Salt Lake City, Nr | April-July | 4.1 | 4.9 | 6.3 | 98 | 7 | 8 |
| Dell Fk | |||||||
| Little Dell Res | April-July | 4 | 5.1 | 6.7 | 122 | 7.4 | 9.1 |
| Lambs Ck | |||||||
| Salt Lake City, Nr | April-July | 3.7 | 4.7 | 6.3 | 119 | 7 | 8.4 |
| Parleys Ck | |||||||
| Salt Lake City, Nr | April-July | 9.9 | 12.4 | 17.4 | 123 | 19.3 | 23 |
| Emigration Ck | |||||||
| Salt Lake City, Nr | April-July | 1.7 | 2.4 | 3.8 | 95 | 4.5 | 6.2 |
| Red Butte Ck | |||||||
| Ft Douglas, At, Salt Lake City, Nr | April-July | 1.1 | 1.5 | 1.9 | 99 | 2.3 | 2.8 |
| City Ck | |||||||
| Salt Lake City, Nr | April-July | 5.1 | 6.1 | 7.2 | 94 | 8 | 9.4 |
| S Willow Ck | |||||||
| Grantsville, Nr | April-July | 2 | 2.3 | 3.1 | 100 | 3.4 | 3.9 |
| Forecast Period | 90% Exceedance Volume | 70% Exceedance Volume | 50% Exceedance Volume | Percent Average | 30% Exceedance Volume | 10% Exceedance Volume | |
| Spanish Fork | |||||||
| Castilla, Nr | April-July | 52 | 70 | 90 | 130 | 102 | 120 |
| Provo | |||||||
| Woodland, Nr | April-July | 88 | 108 | 119 | 119 | 130 | 145 |
| Hailstone, Nr | April-July | 98 | 115 | 130 | 118 | 143 | 161 |
| Deer Ck Res | April-July | 117 | 138 | 160 | 126 | 174 | 195 |
| American Fork | |||||||
| American Fork, Nr, Up Pwrplnt, Abv | April-July | 27 | 33 | 38 | 123 | 42 | 46 |
| West Canyon Ck | |||||||
| Cedar Fort, Nr | April-July | 0.85 | 1.5 | 2.3 | 131 | 3.5 | 5 |
| Salt Ck | |||||||
| Nephi Powerplant Div, Blo | April-July | 8.7 | 12.8 | 17.6 | 212 | 20 | 27 |
| Jordan | |||||||
| Utah Lake, Provo, Nr | April-July | 255 | 340 | 400 | 123 | 460 | 530 |
| Range | Round to | |
| 0-1.99 | 0.01 | |
| 2.0-19.9 | 0.1 | |
| 20-199 | 1.0 | |
| 200-999 | 5.0 | |
| 1000+ | 3 significant digits |