Great Basin Water Supply Outlook, April 1, 2008
Note: This publication is scheduled for revision. If you have feedback on content, format, or publication frequency, please contact us.
Contents
Great Basin Summary
March conditions were much below average for both snow and precipitation every where except in the Bear Basin.
Temperatures ranged from average to below average across northern Utah. Cool day time temperatures (below normal highs)
helped sustain the average to above average snowpack conditions that accumulated from December through February.
As of April 1, 2008 water supply conditions look good with both an average snowpack and average seasonal
precipitation numbers leading into the runoff season. The only much below average precipitation numbers were the March monthly
in the Weber, Six Creeks and Utah Lake areas which ranged from 56% to 67% of average. The Bear finished the month with below average
conditions at 80% of average.
Short term guidance from National Weather Service Models indicates several storm systems during the next 9 days.
This progressive pattern indicates active weather with no large scale ridge structures developing which leads to
rapid warming and snowmelt. Instead we have average to slightly below average current temperatures and a cool
short term forecast which will help in holding snow for several more weeks. This of course leads to the potential
for more efficient runoff conditions when the weather finally turns warm. As of April 1st conditions across the
Great Basin basin are good with normal snow and seasonal precipitation numbers to date.
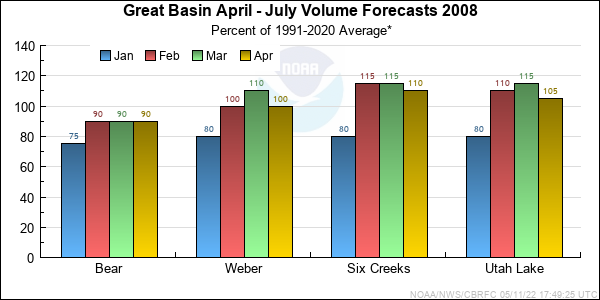
Volumetric forecasts for the Great Basin ranged from 68% at Smith Fork nr Border on the Bear to 115% at
Vernon Creek, West of Utah Lake. The average forecast from 31 points was 102% of the 1971-2000 average.
*Median of forecasts within each basin.
Bear Basin Conditions
Conditions across the Bear River Basin held steady in terms of seasonal precipitation and snow compared to the other basins,
as most weather systems during March focused their moisture on the Northwest and just skimmed the northern egde of Utah. Monthly
precipitation was below average at 80% and seasonal precipitation dropped 3% to 97% of average. Snow water equivalent held mostly
steady at 102% due to cool temperatures. Volumetric forecasts dropped 10% on the low end and 5% at the high end, now ranging
from 58% of average near Montpelier to 106% at the Utah/Wyoming border.
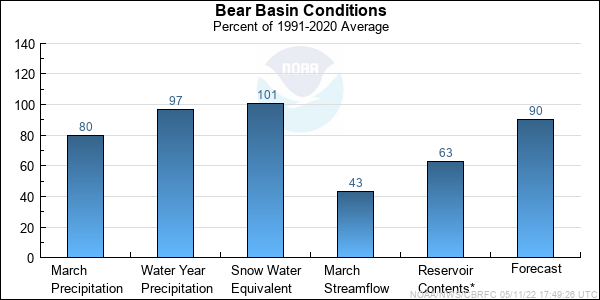
* Percent usable capacity, not percent average contents.
Click for multi-month Graph.
Weber Basin Conditions
The Weber and Ogden River basins had a much below average month for both snow accumulation and precipitation in March.
Monthly precipitation was recorded at 65% of average and season precipitation dropped 6% and now totals 105% of average.
Snow water equivalent numbers decreased from 114% of average to 108% of average at months end. Overall the April through
July volumetric forecasts decreased slightly and range from 100% to 106% of average. At the top end this is a 10% decrease
over the March 1st forecasts.
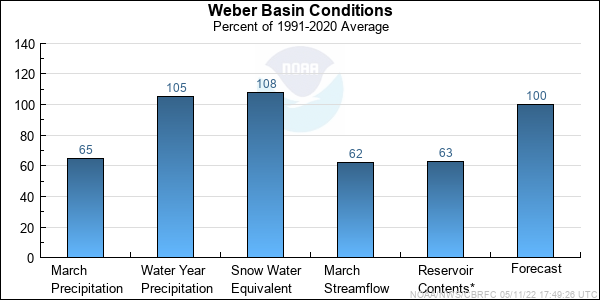
* Percent usable capacity, not percent average contents.
Click for multi-month Graph.
Six Creeks Basin Conditions
The Six Creeks basin experienced the same conditions as the Weber and Ogden basins experiencing cool temperatures for the month
with much below average precipition. Monthly precipitation was much below average at 65% and seasonal precipitation dropped from
121% of average to 109% of average. Indexed snow numbers for the basin dropped from 131% of average to 124% of average. This still
represents above average snow conditions and largest snowpack as a percent of average in the Northern Great Basin basin.
April through July volume forecasts range from 105% to 114% of average, which represent about a 7% decrease in April through
July volumes.
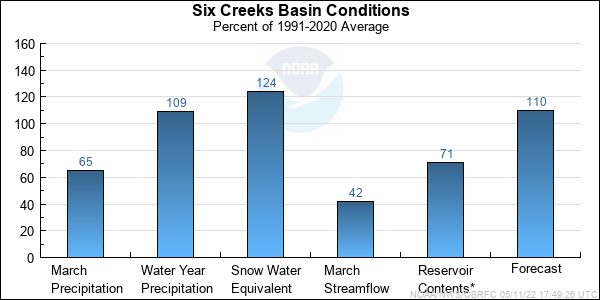
* Percent usable capacity, not percent average contents.
Click for multi-month Graph.
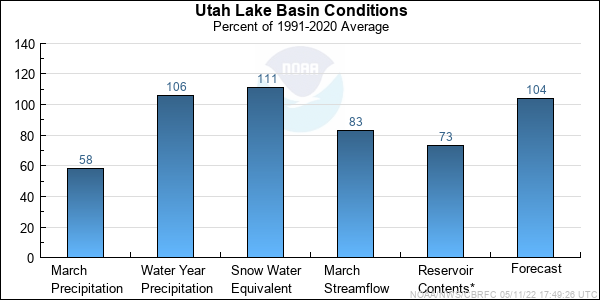
Utah Lake Basin Conditions
The Utah Lake Basin was the driest of all 4 basins during March yet enters April with an above average snowpack and average
seasonal precipitation numbers. Monthly precipitation was much below average at 58% and seasonal values dropped 11% to 106% of
average. Currently the indexed snow for the Utah Lake Basin is 111% of average. This snow pack value is on the cusp of normal
to above average. April through July water supply forecast decreased by an average 7% and now range from 103% to 105% of average.
* Percent usable capacity, not percent average contents.
Click for multi-month Graph.
Differences between the full period forecasts and the residual forecasts may not exactly equal the actual observed volumes due to rounding conventions (see Definitions section).
Precipitation Maps


Hydrologist: Brent Bernard
