
NOAA, National Weather Service
Colorado Basin River Forecast Center
Salt Lake City, Utah
www.cbrfc.noaa.gov
| Prepared by Brent Bernard NOAA, National Weather Service Colorado Basin River Forecast Center Salt Lake City, Utah www.cbrfc.noaa.gov |
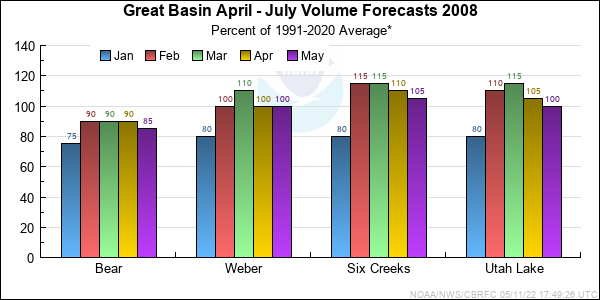
| Forecast Period | 90% Exceedance Volume | 50% Exceedance Volume | Percent Average | 10% Exceedance Volume | |
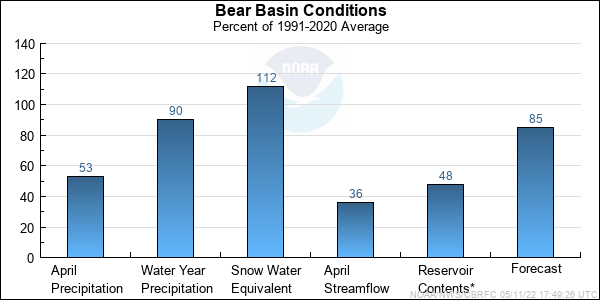
| Bear | |||||
| Utah | April-July | 99 | 112 | 99 | 127 |
| May-July | 96 | 110 | 103 | 124 | |
| Woodruff Narrows Res | April-July | 90 | 119 | 79 | 159 |
| May-July | 58 | 111 | 96 | 140 | |
| Big Ck | |||||
| Randolph, Nr | April-July | 0.95 | 4.5 | 92 | 8.1 |
| May-July | 0.85 | 4 | 93 | 7.2 | |
| Smiths Fork | |||||
| Border, Nr | April-July | 62 | 84 | 82 | 106 |
| May-July | 59 | 80 | 84 | 101 | |
| Bear | |||||
| Montpelier, Nr, Stewart Dam, Blo | April-July | 55 | 110 | 47 | 260 |
| May-July | 30 | 80 | 43 | 215 | |
| Logan | |||||
| Logan, Nr, State Dam, Abv | April-July | 84 | 107 | 85 | 130 |
| May-July | 78 | 100 | 93 | 122 | |
| Blacksmith Fork | |||||
| Hyrum, Nr, Upnl Dam, Abv | April-July | 14.7 | 38 | 79 | 61 |
| May-July | 12.8 | 32 | 80 | 51 |
| Forecast Period | 90% Exceedance Volume | 50% Exceedance Volume | Percent Average | 10% Exceedance Volume | |
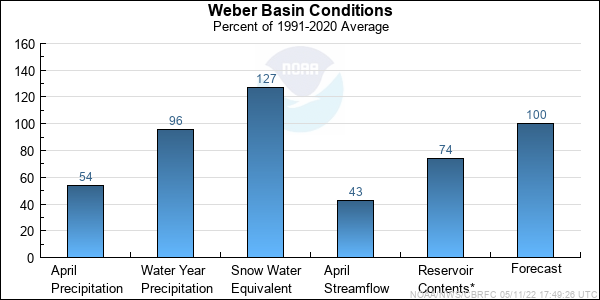
| Weber | |||||
| Oakley, Nr | April-July | 97 | 120 | 98 | 143 |
| May-July | 93 | 115 | 102 | 137 | |
| Rockport Res, Wanship, Nr | April-July | 97 | 135 | 101 | 173 |
| May-July | 82 | 120 | 100 | 158 | |
| Coalville, Nr | April-July | 61 | 129 | 93 | 197 |
| May-July | 79 | 116 | 99 | 153 | |
| Chalk Ck | |||||
| Coalville | April-July | 24 | 42 | 93 | 60 |
| May-July | 22 | 38 | 103 | 54 | |
| Weber | |||||
| Echo Res, Echo, At | April-July | 127 | 178 | 99 | 230 |
| May-July | 98 | 150 | 99 | 200 | |
| Lost Ck | |||||
| Lost Ck Res, Croydon, Nr | April-July | 5.6 | 13 | 74 | 20 |
| May-July | 4.3 | 11 | 85 | 17.7 | |
| East Canyon Ck | |||||
| East Canyon Res, Morgan, Nr | April-July | 18.8 | 32 | 103 | 45 |
| May-July | 14.1 | 24 | 109 | 34 | |
| Weber | |||||
| Gateway | April-July | 220 | 325 | 92 | 430 |
| May-July | 168 | 270 | 99 | 370 | |
| Sf Ogden | |||||
| Huntsville, Nr | April-July | 39 | 58 | 91 | 77 |
| May-July | 32 | 48 | 102 | 64 | |
| Ogden | |||||
| Pineview Res, Ogden, Nr | April-July | 78 | 123 | 92 | 168 |
| May-July | 56 | 93 | 104 | 130 | |
| Wheeler Ck | |||||
| Huntsville, Nr | April-July | 3.9 | 6.3 | 100 | 8.7 |
| May-July | 2.3 | 4.6 | 107 | 6.9 |
| Forecast Period | 90% Exceedance Volume | 50% Exceedance Volume | Percent Average | 10% Exceedance Volume | |
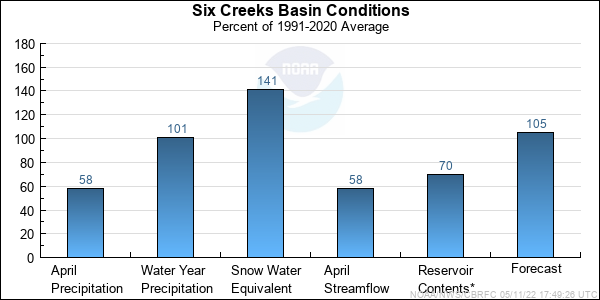
| Little Cottonwood Ck | |||||
| Salt Lake City, Nr | April-July | 35 | 43 | 108 | 51 |
| May-July | 32 | 40 | 108 | 48 | |
| Big Cottonwood Ck | |||||
| Salt Lake City, Nr | April-July | 32 | 40 | 105 | 48 |
| May-July | 28 | 37 | 112 | 46 | |
| Mill Ck | |||||
| Salt Lake City, Nr | April-July | 4.1 | 6.7 | 96 | 9.3 |
| May-July | 4 | 6.2 | 105 | 8.5 | |
| Dell Fk | |||||
| Little Dell Res | April-July | 3.5 | 6.4 | 94 | 9.3 |
| May-July | 3 | 5.6 | 112 | 8.2 | |
| Parleys Ck | |||||
| Salt Lake City, Nr | April-July | 6.4 | 13 | 78 | 19.6 |
| May-July | 6.8 | 12.5 | 98 | 18.2 | |
| Emigration Ck | |||||
| Salt Lake City, Nr | April-July | 0.82 | 3.4 | 76 | 6 |
| May-July | 0.94 | 3.2 | 103 | 5.5 | |
| City Ck | |||||
| Salt Lake City, Nr | April-July | 5.3 | 8.6 | 99 | 11.9 |
| May-July | 5 | 8 | 110 | 11 | |
| Vernon Ck | |||||
| Vernon, Nr | April-June | 0.41 | 1.5 | 101 | 2.6 |
| May-June | 0.21 | 1 | 128 | 1.8 | |
| S Willow Ck | |||||
| Grantsville, Nr | April-July | 2.4 | 3.4 | 106 | 4.4 |
| May-July | 1.9 | 2.9 | 104 | 3.9 |
| Forecast Period | 90% Exceedance Volume | 50% Exceedance Volume | Percent Average | 10% Exceedance Volume | |
| Spanish Fork | |||||
| Castilla, Nr | April-July | 36 | 78 | 101 | 120 |
| May-July | 29 | 67 | 112 | 105 | |
| Provo | |||||
| Woodland, Nr | April-July | 82 | 103 | 100 | 124 |
| May-July | 71 | 90 | 98 | 109 | |
| Hailstone, Nr | April-July | 78 | 108 | 99 | 138 |
| May-July | 68 | 100 | 105 | 132 | |
| Deer Ck Res | April-July | 85 | 121 | 96 | 157 |
| May-July | 65 | 104 | 102 | 143 | |
| American Fork | |||||
| American Fork, Nr, Up Pwrplnt, Abv | April-July | 25 | 33 | 103 | 41 |
| May-July | 22 | 30 | 100 | 38 | |
| Jordan | |||||
| Utah Lake, Provo, Nr | April-July | 154 | 325 | 100 | 500 |
| May-July | 95 | 245 | 103 | 395 |
| Range | Round to | |
| 0-1.99 | 0.01 | |
| 2.0-19.9 | 0.1 | |
| 20-199 | 1.0 | |
| 200-999 | 5.0 | |
| 1000+ | 3 significant digits |

