Sevier Water Supply Outlook, March 1, 2008

Note: This publication is scheduled for revision. If you have feedback on content, format, or publication frequency, please contact us.
Prepared by Reed
NOAA, National Weather Service
Colorado Basin River Forecast Center
Salt Lake City, Utah
www.cbrfc.noaa.gov

Contents

Sevier Summary

Precipitation in December 2007 was 255% of average followed by 160% of average in January 2008, and then 130% of average in February. The seasonal precipitation is 120% of average. Snow pack decreased from 140% of average on February 1st to 130% of average on March 1st. 
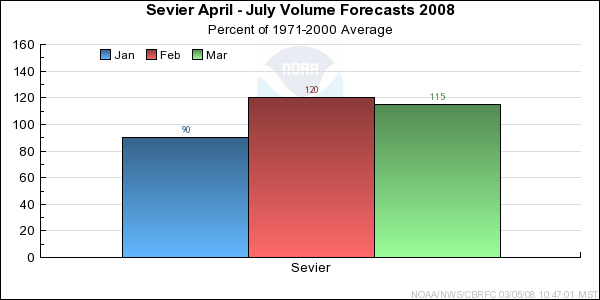
This equates to 110% of the seasonal snowfall accumulation. The runoff forecasts for April-July 2008 range from 107% to 124% of average. This reflects a slight drop over last month's forecasts resulting from the slight drop in average snowpack throughout the Sevier River Basin.


*Median of forecasts within each basin.


Sevier Basin Conditions


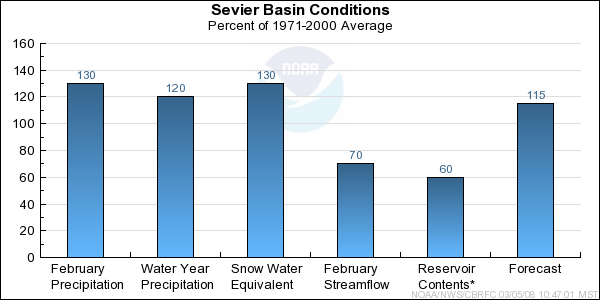
* Percent usable capacity, not percent average contents.
Click for multi-month Graph.


Sevier Specific Site Forecasts (kaf)

Click site name for graph.
Forecast
Period
90%
Exceedance
Volume
50%
Exceedance
Volume
Percent
Average
10%
Exceedance
Volume
Sevier
Hatch April-July416612096
Kingston, Nr April-July70108121155
Ef Sevier
Kingston, Nr April-July19.94311366
Sevier
Piute Res, Marysvale, Nr April-July92156124220
Clear Ck
Sevier, Nr, Div, Abv April-July15.32611837
Sevier
Vermillion Dam April-July141210122275
Sigurd, Nr April-July126225121325
Salina Ck
Salina April-July0.592110742
Sevier
Gunnison, Nr, San Pitch, Blo April-July156315113530
Chicken Ck
Levan, Nr April-July2.45.21169.5
Oak Ck
Oak City, Nr, Little Ck, Abv April-July1.221202.9
Beaver
Beaver, Nr April-July212910739
Minersville Res, Minersville, Nr April-July8.418.511133
Coal Ck
Cedar City, Nr April-July172412432

Differences between the full period forecasts and the residual forecasts may not exactly equal the actual observed volumes due to rounding conventions (see Definitions section).

Sevier Reservoir Contents (kaf)

Usable
Capacity
EOM
Contents
Percent
Usable
Capacity
Last Year
EOM
Last Year
%Capacity
untitled Otter Ck
Otter Creek Res, Antimony, Nr 52.5 29.5 56 39.9 76
untitled Sevier
Piute Res, Marysvale, Nr 71.8 43.5 61 64.3 90
untitled Gunnison Reservoir
20.3 2.4 12 14.0 69
untitled Sevier Bridge Reservoir, Juab, Nr
236.0 149.3 63 185.8 79
untitled Beaver
Minersville Res, Minersville, Nr 23.3 10.8 46 13.2 57
untitled
TOTAL 403.9 235.5 58 317.2 79

Precipitation Maps


Definitions

10% exceedance forecast: Given the current hydrometeorological conditions, i.e current snowpack, soil moisture and streamflow, the volume that has a 10% chance of being exceeded. Previously referred to as "Reasonable Maximum Forecast".

50% exceedance forecast: Given the current hydrometeorological conditions, i.e current snowpack, soil moisture and streamflow, the volume that has a 50% chance of being exceeded. Previously referred to as "Most Probable Forecast".

90% exceedance forecast: Given the current hydrometeorological conditions, i.e current snowpack, soil moisture and streamflow, the volume that has a 90% chance of being exceeded. Previously referred to as "Reasonable Minimum Forecast".

Acre-Foot (af): The volume equal to one acre covered one foot deep (43,560 cubic feet). See kaf below.

Average: The arithmetic mean. The sum of the values divided by the number of values. Values from 1971-2000 are used for this publication.

Categories: Much Above Average=Greater than 130%, Above Average=111-130%, Near Average=90-110%, Below Average=70-89%, Much Below Average=Less than 70%.

CBRFC: Colorado Basin River Forecast Center.

Forecast Period: The period from April 1 through July 31, unless otherwise noted.

kaf: Thousand Acre-Feet. See Acre-Foot above.

Inflow: The volume of water that flows into a reservoir or lake.

Median: The middle value of an ordered set of values. Half of the values are higher and half of the values are lower. When the set contains an even number of values the median is the average of the two middle numbers.

NOAA: National Oceanic and Atomospheric Administration.

NWS: National Weather Service.

Rounding Conventions:
RangeRound to
0-1.990.01
2.0-19.90.1
20-1991.0
200-9995.0
1000+3 significant digits


Streamflow: The volume of water that flows past a specific stream site.

Water Year: The 12-month period, October 1 through September 30. The water year is designated by the calendar year in which it ends. Thus, the year ending September 30, 2008, is called the "2008 water year."


Additional Information

Water supply forecasts take into consideration present hydrometeorological conditions and use average basin temperatures and precipitation for the forecast period. As the forecast season progresses, a greater portion of the future hydrologic and climatic uncertainty becomes known and monthly forecasts become more accurate. For more information on the tools we use, consult Water Supply Forecasting Tools.

Volume forecasts represent adjusted flows; that is, observed flows with upstream water use taken into account. Adjusted flows will closely approximate natural or unimpaired flows. However, not all upstream diversions or impoundments are measured or quantifiable. For specific adjustments used with each forecast point, consult the Guide to Water Supply Forecasting.

The Water Supply Outlook is issued monthly January through May by the Colorado Basin River Forecast Center. It represents a coordinated effort between the National Weather Service, Natural Resources Conservation Service, Bureau of Reclamation, U.S. Geological Survey and local water district managers.

Note: Data used in this report are provisional and are subject to revision.

For more information, or to be included on the mailing list, please contact:

Colorado Basin River Forecast Center
2242 W North Temple
Salt Lake City, UT 84116
(801) 524-5130
www.cbrfc.noaa.gov


Hydrologist: Reed