NOAA, National Weather Service
Colorado Basin River Forecast Center
Salt Lake City, Utah
www.cbrfc.noaa.gov
| Prepared by Cody Moser, Greg Smith NOAA, National Weather Service Colorado Basin River Forecast Center Salt Lake City, Utah www.cbrfc.noaa.gov |
| Forecast Period | 90% Exceedance Volume | 70% Exceedance Volume | 50% Exceedance Volume | Percent Average | 30% Exceedance Volume | 10% Exceedance Volume | |
| Colorado | |||||||
| Lake Granby, Granby, Nr | April-July | 140 | 180 | 210 | 95 | 260 | 320 |
| Willow Ck | |||||||
| Willow Ck Res, Granby, Nr | April-July | 21 | 33 | 44 | 94 | 60 | 77 |
| Fraser | |||||||
| Winter Park | April-July | 12 | 15 | 17.9 | 92 | 21 | 24 |
| Williams Fork | |||||||
| Williams Fork Res, Parshall, Nr | April-July | 54 | 68 | 80 | 83 | 98 | 117 |
| Muddy Ck | |||||||
| Wolford Mountain Reservoir | April-July | 22 | 35 | 46 | 85 | 60 | 76 |
| Blue | |||||||
| Dillon Res | April-July | 98 | 120 | 141 | 87 | 168 | 200 |
| Green Mtn Res | April-July | 155 | 195 | 230 | 84 | 280 | 335 |
| Colorado | |||||||
| Kremmling, Nr | April-July | 470 | 620 | 760 | 88 | 940 | 1140 |
| Eagle | |||||||
| Gypsum, Blo | April-July | 195 | 240 | 280 | 84 | 350 | 435 |
| Colorado | |||||||
| Dotsero, Nr | April-July | 780 | 1000 | 1210 | 86 | 1520 | 1860 |
| Frying Pan | |||||||
| Ruedi Res, Basalt, Nr | April-July | 74 | 92 | 110 | 79 | 135 | 165 |
| Roaring Fork | |||||||
| Glenwood Springs | April-July | 395 | 480 | 550 | 80 | 660 | 795 |
| Colorado | |||||||
| Glenwood Springs, Blo | April-July | 1200 | 1550 | 1820 | 86 | 2250 | 2730 |
| Cameo, Nr | April-July | 1340 | 1700 | 2000 | 85 | 2500 | 3100 |
| Plateau Ck | |||||||
| Cameo, Nr | April-July | 50 | 70 | 85 | 69 | 115 | 155 |
| Colorado | |||||||
| Cisco, Nr | April-July | 2400 | 2900 | 3300 | 74 | 4000 | 5000 |
| Lake Powell, Glen Cyn Dam, At | April-July | 2600 | 3450 | 4550 | 64 | 5580 | 7600 |
| Forecast Period | 90% Exceedance Volume | 70% Exceedance Volume | 50% Exceedance Volume | Percent Average | 30% Exceedance Volume | 10% Exceedance Volume | |
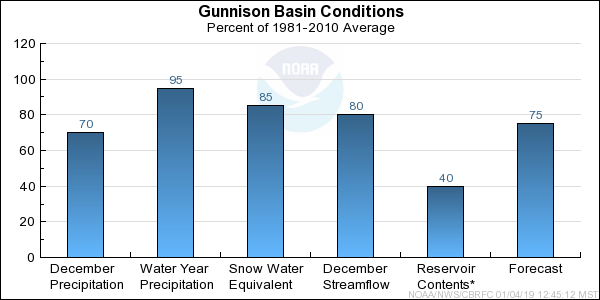
| Taylor | |||||||
| Taylor Park Res | April-July | 50 | 62 | 75 | 76 | 88 | 115 |
| Almont | April-July | 80 | 100 | 113 | 73 | 130 | 183 |
| East | |||||||
| Almont | April-July | 90 | 120 | 137 | 75 | 172 | 235 |
| Gunnison | |||||||
| Gunnison, Nr | April-July | 190 | 240 | 265 | 72 | 335 | 465 |
| Tomichi Ck | |||||||
| Gunnison | April-July | 23 | 38 | 48 | 65 | 58 | 88 |
| Lake Fork | |||||||
| Gateview | April-July | 60 | 82 | 98 | 80 | 110 | 138 |
| Gunnison | |||||||
| Blue Mesa Res | April-July | 360 | 430 | 500 | 74 | 610 | 755 |
| Morrow Point Res | April-July | 405 | 460 | 545 | 74 | 650 | 800 |
| Crystal Res | April-July | 470 | 520 | 610 | 73 | 720 | 865 |
| Muddy Ck | |||||||
| Paonia Res, Bardine, Nr | March-June | 40 | 52 | 65 | 68 | 73 | 100 |
| April-July | 40 | 52 | 65 | 67 | 73 | 100 | |
| Nf Gunnison | |||||||
| Somerset, Nr | April-July | 160 | 190 | 215 | 73 | 260 | 330 |
| Surface Ck | |||||||
| Cedaredge | April-July | 9 | 11 | 14 | 83 | 16 | 21 |
| Uncompahgre | |||||||
| Ridgway Res | April-July | 50 | 68 | 74 | 73 | 88 | 110 |
| Colona | April-July | 55 | 79 | 88 | 64 | 110 | 145 |
| Delta | April-July | 35 | 50 | 64 | 57 | 86 | 125 |
| Gunnison | |||||||
| Grand Junction, Nr | April-July | 750 | 900 | 1030 | 70 | 1300 | 1570 |
| Forecast Period | 90% Exceedance Volume | 70% Exceedance Volume | 50% Exceedance Volume | Percent Average | 30% Exceedance Volume | 10% Exceedance Volume | |
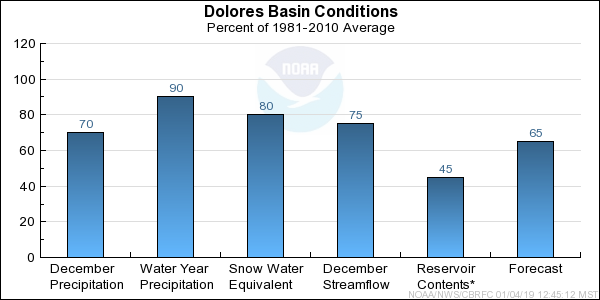
| Dolores | |||||||
| Dolores | April-July | 106 | 135 | 170 | 69 | 220 | 270 |
| Mcphee Res | April-July | 110 | 145 | 190 | 64 | 260 | 325 |
| San Miguel | |||||||
| Placerville, Nr | April-July | 50 | 71 | 83 | 65 | 98 | 130 |
| Dolores | |||||||
| Cisco, Nr | April-July | 175 | 250 | 330 | 58 | 410 | 575 |
| Range | Round to | |
| 0-1.99 | 0.01 | |
| 2.0-19.9 | 0.1 | |
| 20-199 | 1.0 | |
| 200-999 | 5.0 | |
| 1000+ | 3 significant digits |