Upper Colorado Water Supply Outlook, February 1, 2008

Note: This publication is scheduled for revision. If you have feedback on content, format, or publication frequency, please contact us.
Prepared by Brenda Alcorn, John Lhotak
NOAA, National Weather Service
Colorado Basin River Forecast Center
Salt Lake City, Utah
www.cbrfc.noaa.gov

Contents

Upper Colorado Summary

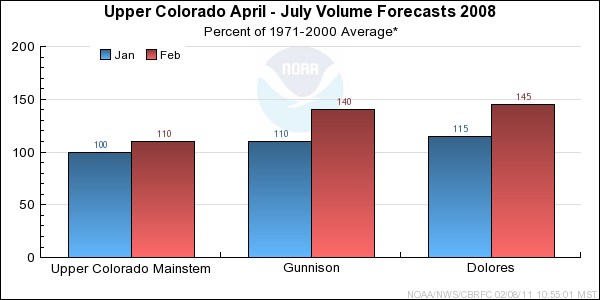
Although the January percent of average monthly precipitation was not quite as high as December, it was still much above average across the Upper Colorado Basin. As a result, the February 1 snow water equivalent percent of average values rose 15% in the Upper Colorado mainstem and 30% in the Gunnison and Dolores basins from the January 1 values. Forecasts of the April through July runoff volumes rose 10% to 40% from those issued January 1.


*Median of forecasts within each basin.


Upper Colorado Mainstem Basin Conditions

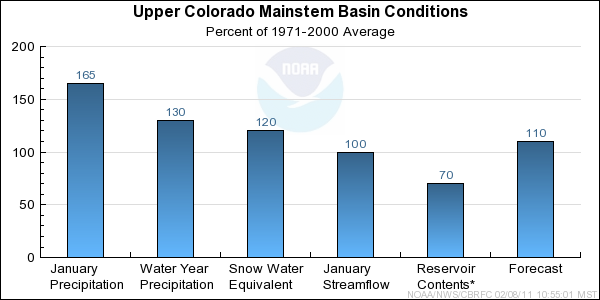
January was another wet month in the Upper Colorado mainstem with 165% of the basin average precipitation. This brought the seasonal precipitation to 130% of average and the snow water equivalent to 120% of average as of February 1st. However, the snowpack is not uniform across the basin. The Roaring Fork and Plateau Creek basins represent the high end of the spectrum with close to 150% of average snow water equivalent, while the basins above Kremmling generally have between 100% and 115% of average snow water equivalent. Because of the great gains in the snowpack all forecasts increased from last month, with the Roaring Fork and Plateau Creek points changing the most. The April through July streamflow forecasts now range between 100% and 130% of average.


* Percent usable capacity, not percent average contents.
Click for multi-month Graph.

Gunnison Basin Conditions

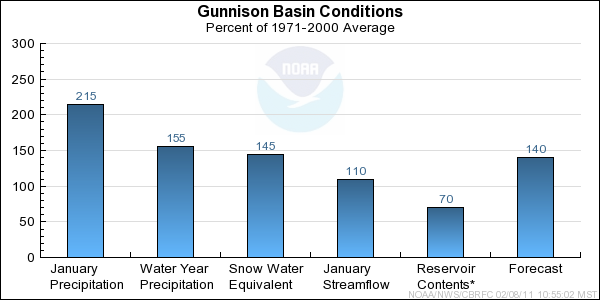
Above average precipitation continued in the Gunnison Basin for the month of January with the basin receiving 215% of the monthly average. The basin is now at 155% of the seasonal average as of February 1st. All SNOTEL gages in the basin are now above 70% of their average seasonal maximum snowpack accumulation. Three SNOTELs, Overland Res. (127%), Park Cone (111%), and Columbine Pass (111%), have already accumulated over 100% of their average seasonal maximum snowpack. Even though precipitation was above normal for January, streamflow remains around average since most precipitation fell as snow. April through July volume forecasts have increased because of the above average snow fall. Volume forecasts now range from 131% of average at Taylor Park Reservoir to 152% of average at Paonia Reservoir.


* Percent usable capacity, not percent average contents.
Click for multi-month Graph.

Dolores Basin Conditions

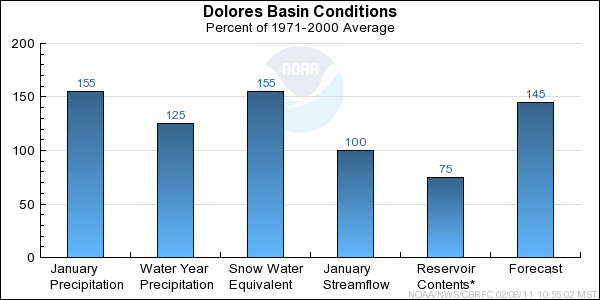
Monthly precipitation in the Dolores Basin for January was above normal. The precipitation total was not as impressive as December but still much above average at 155% of the monthly average. Seasonal precipitation is now at 125% as of February 1st. All SNOTEL gages in the Dolores are above 80% of their average seasonal maximum snowpack accumulation. Scotch Creek (105%) and Lizard Head Pass (105%) are already above 100% of their average seasonal maximum snowpack accumulation. Even though precipitation was above normal for January, streamflow remains around average since most precipitation fell as snow. April through July volume forecasts have increased because of the above average snow fall. Volume forecasts now range from 136% of average on the San Miguel River at Placerville to 159% of average on the Dolores River at Cisco.


* Percent usable capacity, not percent average contents.
Click for multi-month Graph.


Upper Colorado Mainstem Specific Site Forecasts (kaf)

Click site name for graph.
Forecast
Period
90%
Exceedance
Volume
50%
Exceedance
Volume
Percent
Average
10%
Exceedance
Volume
Colorado
Lake Granby, Granby, Nr April-July171225100285
Willow Ck
Willow Ck Res, Granby, Nr April-July435811476
Fraser
Winter Park April-July142010026
Williams Fork
Williams Fork Res, Parshall, Nr April-July79103108130
Muddy Ck
Wolford Mtn Res, Blo April-July426010082
Blue
Dillon Res April-July135180108235
Green Mtn Res April-July230310111405
Colorado
Kremmling, Nr April-July6459301071210
Eagle
Gypsum, Blo April-July260370110505
Colorado
Dotsero, Nr April-July115015501082010
Frying Pan
Ruedi Res, Basalt, Nr April-July134180128235
Roaring Fork
Glenwood Springs April-July6959301311220
Colorado
Glenwood Springs, Blo April-July180024501133100
Cameo, Nr April-July196027501143540
Plateau Ck
Cameo, Nr April-July67150130235
Colorado
Cisco, Nr April-July405060301308010
Mill Ck
Moab, Nr, Sheley Tun, At April-July3.45.71149
Colorado
Lake Powell, Glen Cyn Dam, At April-July6110950012012900


Gunnison Specific Site Forecasts (kaf)

Click site name for graph.
Forecast
Period
90%
Exceedance
Volume
50%
Exceedance
Volume
Percent
Average
10%
Exceedance
Volume
Taylor
Taylor Park Res April-July98135131178
Almont April-July164220133275
East
Almont April-July198265138340
Gunnison
Gunnison, Nr April-July390540138710
Tomichi Ck
Gunnison April-July57110136189
Lake Fork
Gateview April-July128170135220
Gunnison
Blue Mesa Res April-July68510001391400
Morrow Point Res April-July80011001401400
Crystal Res April-July87512501371620
Muddy Ck
Paonia Res, Bardine, Nr March-June91150150230
April-July91155152245
Nf Gunnison
Somerset, Nr April-July320460151560
Surface Ck
Cedaredge April-July17.32514635
Uncompahgre
Ridgway Res April-July101140137188
Colona April-July127190137270
Delta April-July84165141245
Gunnison
Grand Junction, Nr April-July166022501442840


Dolores Specific Site Forecasts (kaf)

Click site name for graph.
Forecast
Period
90%
Exceedance
Volume
50%
Exceedance
Volume
Percent
Average
10%
Exceedance
Volume
Dolores
Dolores April-July250385145480
Mcphee Res April-July300470147540
San Miguel
Placerville, Nr April-July125180136250
Dolores
Cisco, Nr April-July6409801591320

Differences between the full period forecasts and the residual forecasts may not exactly equal the actual observed volumes due to rounding conventions (see Definitions section).

Upper Colorado Reservoir Contents (kaf)

Usable
Capacity
EOM
Contents
Percent
Usable
Capacity
Last Year
EOM
Last Year
%Capacity
untitled Colorado
Lake Granby, Granby, Nr 490.3 265.3 54 283.9 58
untitled Blue
Dillon Res 254.0 240.0 94 241.0 95
Green Mtn Res 146.9 84.4 57 86.6 59
untitled Taylor
Taylor Park Res 106.2 78.3 74 78.3 74
untitled Gunnison
Blue Mesa Res 829.5 520.1 63 524.8 63
untitled Uncompahgre
Ridgway Res 83.2 74.0 89 77.8 94
untitled Dolores
Mcphee Res 381.1 286.1 75 275.0 72
untitled
TOTAL 2291.1 1548.1 68 1567.3 68
Colorado
Lake Powell 24322.0 10880.4 45 11703.4 48
untitled
TOTAL 24322.0 10880.4 45 11703.4 48

Precipitation Maps


Definitions

10% exceedance forecast: Given the current hydrometeorological conditions, i.e current snowpack, soil moisture and streamflow, the volume that has a 10% chance of being exceeded. Previously referred to as "Reasonable Maximum Forecast".

50% exceedance forecast: Given the current hydrometeorological conditions, i.e current snowpack, soil moisture and streamflow, the volume that has a 50% chance of being exceeded. Previously referred to as "Most Probable Forecast".

90% exceedance forecast: Given the current hydrometeorological conditions, i.e current snowpack, soil moisture and streamflow, the volume that has a 90% chance of being exceeded. Previously referred to as "Reasonable Minimum Forecast".

Acre-Foot (af): The volume equal to one acre covered one foot deep (43,560 cubic feet). See kaf below.

Average: The arithmetic mean. The sum of the values divided by the number of values. Values from 1971-2000 are used for this publication.

Categories: Much Above Average=Greater than 130%, Above Average=111-130%, Near Average=90-110%, Below Average=70-89%, Much Below Average=Less than 70%.

CBRFC: Colorado Basin River Forecast Center.

Forecast Period: The period from April 1 through July 31, unless otherwise noted.

kaf: Thousand Acre-Feet. See Acre-Foot above.

Inflow: The volume of water that flows into a reservoir or lake.

Median: The middle value of an ordered set of values. Half of the values are higher and half of the values are lower. When the set contains an even number of values the median is the average of the two middle numbers.

NOAA: National Oceanic and Atomospheric Administration.

NWS: National Weather Service.

Rounding Conventions:
RangeRound to
0-1.990.01
2.0-19.90.1
20-1991.0
200-9995.0
1000+3 significant digits


Streamflow: The volume of water that flows past a specific stream site.

Water Year: The 12-month period, October 1 through September 30. The water year is designated by the calendar year in which it ends. Thus, the year ending September 30, 2008, is called the "2008 water year."


Additional Information

Water supply forecasts take into consideration present hydrometeorological conditions and use average basin temperatures and precipitation for the forecast period. As the forecast season progresses, a greater portion of the future hydrologic and climatic uncertainty becomes known and monthly forecasts become more accurate. For more information on the tools we use, consult Water Supply Forecasting Tools.

Volume forecasts represent adjusted flows; that is, observed flows with upstream water use taken into account. Adjusted flows will closely approximate natural or unimpaired flows. However, not all upstream diversions or impoundments are measured or quantifiable. For specific adjustments used with each forecast point, consult the Guide to Water Supply Forecasting.

The Water Supply Outlook is issued monthly January through May by the Colorado Basin River Forecast Center. It represents a coordinated effort between the National Weather Service, Natural Resources Conservation Service, Bureau of Reclamation, U.S. Geological Survey and local water district managers.

Note: Data used in this report are provisional and are subject to revision.

For more information, or to be included on the mailing list, please contact:

Colorado Basin River Forecast Center
2242 W North Temple
Salt Lake City, UT 84116
(801) 524-5130
www.cbrfc.noaa.gov


Hydrologist: Brenda Alcorn, John Lhotak