NOAA, National Weather Service
Colorado Basin River Forecast Center
Salt Lake City, Utah
www.cbrfc.noaa.gov
| Prepared by Brenda Alcorn, Greg Smith NOAA, National Weather Service Colorado Basin River Forecast Center Salt Lake City, Utah www.cbrfc.noaa.gov |

| Forecast Period | 90% Exceedance Volume | 70% Exceedance Volume | 50% Exceedance Volume | Percent Average | 30% Exceedance Volume | 10% Exceedance Volume | |
| Colorado | |||||||
| Lake Granby, Granby, Nr | April-July | 135 | 160 | 190 | 86 | 220 | 290 |
| Willow Ck | |||||||
| Willow Ck Res, Granby, Nr | April-July | 30 | 43 | 48 | 102 | 58 | 88 |
| Fraser | |||||||
| Winter Park | April-July | 16 | 18 | 21 | 108 | 23 | 26 |
| Williams Fork | |||||||
| Williams Fork Res, Parshall, Nr | April-July | 65 | 85 | 94 | 98 | 102 | 132 |
| Muddy Ck | |||||||
| Wolford Mountain Reservoir | April-July | 32 | 45 | 57 | 106 | 65 | 80 |
| Blue | |||||||
| Dillon Res | April-July | 120 | 146 | 165 | 101 | 177 | 225 |
| Green Mtn Res | April-July | 192 | 235 | 280 | 102 | 300 | 380 |
| Colorado | |||||||
| Kremmling, Nr | April-July | 575 | 730 | 820 | 95 | 925 | 1200 |
| Eagle | |||||||
| Gypsum, Blo | April-July | 230 | 275 | 320 | 96 | 375 | 480 |
| Colorado | |||||||
| Dotsero, Nr | April-July | 950 | 1170 | 1340 | 96 | 1500 | 1920 |
| Frying Pan | |||||||
| Ruedi Res, Basalt, Nr | April-July | 95 | 113 | 140 | 101 | 150 | 195 |
| Roaring Fork | |||||||
| Glenwood Springs | April-July | 500 | 600 | 700 | 101 | 750 | 965 |
| Colorado | |||||||
| Glenwood Springs, Blo | April-July | 1470 | 1800 | 2060 | 98 | 2250 | 2900 |
| Cameo, Nr | April-July | 1670 | 2000 | 2300 | 97 | 2500 | 3300 |
| Plateau Ck | |||||||
| Cameo, Nr | April-July | 95 | 115 | 135 | 109 | 145 | 205 |
| Colorado | |||||||
| Cisco, Nr | April-July | 3500 | 4000 | 4500 | 101 | 4900 | 6700 |
| Lake Powell, Glen Cyn Dam, At | April-July | 5000 | 6000 | 6700 | 94 | 7500 | 10300 |
| Forecast Period | 90% Exceedance Volume | 70% Exceedance Volume | 50% Exceedance Volume | Percent Average | 30% Exceedance Volume | 10% Exceedance Volume | |
| Taylor | |||||||
| Taylor Park Res | April-July | 65 | 85 | 94 | 95 | 111 | 130 |
| Almont | April-July | 105 | 131 | 145 | 94 | 166 | 200 |
| East | |||||||
| Almont | April-July | 110 | 139 | 160 | 88 | 180 | 225 |
| Gunnison | |||||||
| Gunnison, Nr | April-July | 230 | 295 | 330 | 89 | 385 | 475 |
| Tomichi Ck | |||||||
| Gunnison | April-July | 44 | 60 | 75 | 101 | 88 | 120 |
| Lake Fork | |||||||
| Gateview | April-July | 100 | 115 | 135 | 110 | 153 | 185 |
| Gunnison | |||||||
| Blue Mesa Res | April-July | 460 | 575 | 640 | 95 | 710 | 930 |
| Morrow Point Res | April-July | 520 | 635 | 700 | 95 | 770 | 990 |
| Crystal Res | April-July | 605 | 720 | 785 | 94 | 855 | 1080 |
| Muddy Ck | |||||||
| Paonia Res, Bardine, Nr | March-June | 75 | 88 | 96 | 100 | 112 | 145 |
| April-July | 0 | 0 | 0 | 0 | 0 | 0 | |
| Nf Gunnison | |||||||
| Somerset, Nr | April-July | 210 | 255 | 290 | 98 | 335 | 410 |
| Surface Ck | |||||||
| Cedaredge | April-July | 11 | 15 | 17 | 101 | 20 | 25 |
| Uncompahgre | |||||||
| Ridgway Res | April-July | 82 | 100 | 112 | 111 | 122 | 155 |
| Colona | April-July | 100 | 135 | 150 | 109 | 170 | 220 |
| Delta | April-July | 80 | 110 | 125 | 111 | 145 | 210 |
| Gunnison | |||||||
| Grand Junction, Nr | April-July | 1000 | 1270 | 1450 | 98 | 1700 | 2200 |
| Forecast Period | 90% Exceedance Volume | 70% Exceedance Volume | 50% Exceedance Volume | Percent Average | 30% Exceedance Volume | 10% Exceedance Volume | |
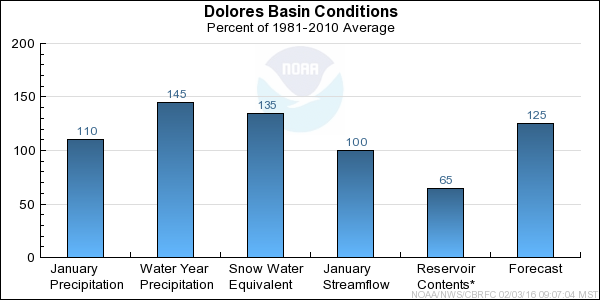
| Dolores | |||||||
| Dolores | April-July | 215 | 265 | 300 | 122 | 345 | 410 |
| Mcphee Res | April-July | 250 | 320 | 365 | 124 | 415 | 500 |
| San Miguel | |||||||
| Placerville, Nr | April-July | 100 | 130 | 147 | 115 | 165 | 195 |
| Dolores | |||||||
| Cisco, Nr | April-July | 440 | 600 | 700 | 124 | 800 | 1000 |
| Range | Round to | |
| 0-1.99 | 0.01 | |
| 2.0-19.9 | 0.1 | |
| 20-199 | 1.0 | |
| 200-999 | 5.0 | |
| 1000+ | 3 significant digits |