NOAA, National Weather Service
Colorado Basin River Forecast Center
Salt Lake City, Utah
www.cbrfc.noaa.gov
| Prepared by Brenda Alcorn, Greg Smith NOAA, National Weather Service Colorado Basin River Forecast Center Salt Lake City, Utah www.cbrfc.noaa.gov |
| Forecast Period | 90% Exceedance Volume | 70% Exceedance Volume | 50% Exceedance Volume | Percent Average | 30% Exceedance Volume | 10% Exceedance Volume | |
| Colorado | |||||||
| Lake Granby, Granby, Nr | April-July | 180 | 220 | 250 | 114 | 280 | 365 |
| Willow Ck | |||||||
| Willow Ck Res, Granby, Nr | April-July | 43 | 55 | 65 | 138 | 85 | 110 |
| Fraser | |||||||
| Winter Park | April-July | 16 | 19 | 23 | 119 | 25 | 29 |
| Williams Fork | |||||||
| Williams Fork Res, Parshall, Nr | April-July | 85 | 105 | 115 | 120 | 130 | 165 |
| Muddy Ck | |||||||
| Wolford Mountain Reservoir | April-July | 35 | 50 | 62 | 115 | 75 | 90 |
| Blue | |||||||
| Dillon Res | April-July | 140 | 175 | 195 | 120 | 215 | 255 |
| Green Mtn Res | April-July | 240 | 295 | 330 | 120 | 360 | 450 |
| Colorado | |||||||
| Kremmling, Nr | April-July | 750 | 950 | 1040 | 121 | 1210 | 1550 |
| Eagle | |||||||
| Gypsum, Blo | April-July | 260 | 320 | 370 | 110 | 410 | 525 |
| Colorado | |||||||
| Dotsero, Nr | April-July | 1200 | 1480 | 1650 | 118 | 1870 | 2370 |
| Frying Pan | |||||||
| Ruedi Res, Basalt, Nr | April-July | 105 | 130 | 160 | 115 | 175 | 220 |
| Roaring Fork | |||||||
| Glenwood Springs | April-July | 600 | 725 | 800 | 116 | 860 | 1070 |
| Colorado | |||||||
| Glenwood Springs, Blo | April-July | 1840 | 2200 | 2450 | 116 | 2700 | 3500 |
| Cameo, Nr | April-July | 2100 | 2550 | 2780 | 118 | 3000 | 4000 |
| Plateau Ck | |||||||
| Cameo, Nr | April-July | 105 | 130 | 150 | 121 | 165 | 215 |
| Colorado | |||||||
| Cisco, Nr | April-July | 4000 | 5000 | 5500 | 124 | 6000 | 7550 |
| Lake Powell, Glen Cyn Dam, At | April-July | 6600 | 8300 | 9600 | 134 | 10500 | 13500 |
| Forecast Period | 90% Exceedance Volume | 70% Exceedance Volume | 50% Exceedance Volume | Percent Average | 30% Exceedance Volume | 10% Exceedance Volume | |
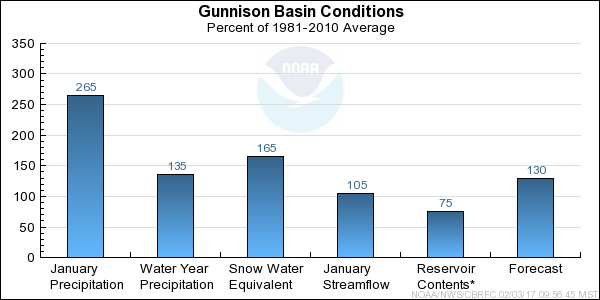
| Taylor | |||||||
| Taylor Park Res | April-July | 99 | 115 | 128 | 129 | 145 | 165 |
| Almont | April-July | 157 | 188 | 210 | 135 | 230 | 265 |
| East | |||||||
| Almont | April-July | 185 | 220 | 245 | 135 | 260 | 315 |
| Gunnison | |||||||
| Gunnison, Nr | April-July | 380 | 460 | 510 | 138 | 560 | 660 |
| Tomichi Ck | |||||||
| Gunnison | April-July | 75 | 92 | 105 | 142 | 120 | 170 |
| Lake Fork | |||||||
| Gateview | April-July | 109 | 128 | 150 | 122 | 167 | 195 |
| Gunnison | |||||||
| Blue Mesa Res | April-July | 690 | 820 | 925 | 137 | 990 | 1250 |
| Morrow Point Res | April-July | 785 | 915 | 1020 | 138 | 1090 | 1350 |
| Crystal Res | April-July | 915 | 1050 | 1150 | 138 | 1220 | 1480 |
| Muddy Ck | |||||||
| Paonia Res, Bardine, Nr | March-June | 95 | 110 | 118 | 123 | 133 | 167 |
| April-July | 96 | 111 | 119 | 123 | 134 | 168 | |
| Nf Gunnison | |||||||
| Somerset, Nr | April-July | 285 | 325 | 355 | 120 | 380 | 480 |
| Surface Ck | |||||||
| Cedaredge | April-July | 15 | 18 | 21 | 125 | 25 | 31 |
| Uncompahgre | |||||||
| Ridgway Res | April-July | 85 | 110 | 118 | 117 | 126 | 160 |
| Colona | April-July | 114 | 142 | 158 | 115 | 171 | 225 |
| Delta | April-July | 82 | 120 | 133 | 118 | 145 | 200 |
| Gunnison | |||||||
| Grand Junction, Nr | April-July | 1480 | 1720 | 1920 | 130 | 1980 | 2650 |
| Forecast Period | 90% Exceedance Volume | 70% Exceedance Volume | 50% Exceedance Volume | Percent Average | 30% Exceedance Volume | 10% Exceedance Volume | |
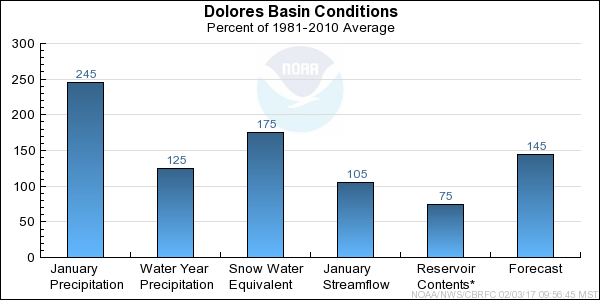
| Dolores | |||||||
| Dolores | April-July | 280 | 335 | 370 | 151 | 400 | 475 |
| Mcphee Res | April-July | 320 | 395 | 440 | 149 | 480 | 570 |
| San Miguel | |||||||
| Placerville, Nr | April-July | 109 | 142 | 155 | 121 | 173 | 210 |
| Dolores | |||||||
| Cisco, Nr | April-July | 550 | 720 | 800 | 142 | 900 | 1110 |
| Range | Round to | |
| 0-1.99 | 0.01 | |
| 2.0-19.9 | 0.1 | |
| 20-199 | 1.0 | |
| 200-999 | 5.0 | |
| 1000+ | 3 significant digits |