NOAA, National Weather Service
Colorado Basin River Forecast Center
Salt Lake City, Utah
www.cbrfc.noaa.gov
| Prepared by Brenda Alcorn, Greg Smith NOAA, National Weather Service Colorado Basin River Forecast Center Salt Lake City, Utah www.cbrfc.noaa.gov |
| Forecast Period | 90% Exceedance Volume | 70% Exceedance Volume | 50% Exceedance Volume | Percent Average | 30% Exceedance Volume | 10% Exceedance Volume | |
| Colorado | |||||||
| Lake Granby, Granby, Nr | April-July | 115 | 145 | 175 | 80 | 195 | 240 |
| Willow Ck | |||||||
| Willow Ck Res, Granby, Nr | April-July | 25 | 35 | 43 | 91 | 48 | 67 |
| Fraser | |||||||
| Winter Park | April-July | 14.5 | 16.5 | 18 | 93 | 21 | 22 |
| Williams Fork | |||||||
| Williams Fork Res, Parshall, Nr | April-July | 60 | 73 | 85 | 89 | 92 | 115 |
| Muddy Ck | |||||||
| Wolford Mountain Reservoir | April-July | 29 | 35 | 48 | 89 | 57 | 70 |
| Blue | |||||||
| Dillon Res | April-July | 105 | 132 | 145 | 89 | 162 | 190 |
| Green Mtn Res | April-July | 170 | 210 | 245 | 89 | 260 | 325 |
| Colorado | |||||||
| Kremmling, Nr | April-July | 530 | 665 | 740 | 86 | 790 | 1060 |
| Eagle | |||||||
| Gypsum, Blo | April-July | 215 | 230 | 285 | 85 | 350 | 450 |
| Colorado | |||||||
| Dotsero, Nr | April-July | 880 | 1060 | 1200 | 86 | 1330 | 1760 |
| Frying Pan | |||||||
| Ruedi Res, Basalt, Nr | April-July | 90 | 100 | 125 | 90 | 145 | 185 |
| Roaring Fork | |||||||
| Glenwood Springs | April-July | 440 | 520 | 590 | 86 | 620 | 830 |
| Colorado | |||||||
| Glenwood Springs, Blo | April-July | 1350 | 1600 | 1810 | 86 | 2050 | 2650 |
| Cameo, Nr | April-July | 1500 | 1790 | 1990 | 84 | 2300 | 2950 |
| Plateau Ck | |||||||
| Cameo, Nr | April-July | 55 | 80 | 105 | 85 | 118 | 160 |
| Colorado | |||||||
| Cisco, Nr | April-July | 2800 | 3370 | 3870 | 87 | 4200 | 5600 |
| Lake Powell, Glen Cyn Dam, At | April-July | 3800 | 4650 | 5700 | 80 | 6500 | 8000 |
| Forecast Period | 90% Exceedance Volume | 70% Exceedance Volume | 50% Exceedance Volume | Percent Average | 30% Exceedance Volume | 10% Exceedance Volume | |
| Taylor | |||||||
| Taylor Park Res | April-July | 65 | 74 | 83 | 84 | 95 | 115 |
| Almont | April-July | 100 | 114 | 127 | 82 | 145 | 175 |
| East | |||||||
| Almont | April-July | 104 | 125 | 135 | 74 | 150 | 195 |
| Gunnison | |||||||
| Gunnison, Nr | April-July | 200 | 240 | 280 | 76 | 300 | 410 |
| Tomichi Ck | |||||||
| Gunnison | April-July | 43 | 55 | 65 | 88 | 77 | 100 |
| Lake Fork | |||||||
| Gateview | April-July | 90 | 106 | 127 | 103 | 142 | 175 |
| Gunnison | |||||||
| Blue Mesa Res | April-July | 450 | 510 | 580 | 86 | 620 | 840 |
| Morrow Point Res | April-July | 500 | 560 | 630 | 85 | 670 | 890 |
| Crystal Res | April-July | 580 | 640 | 710 | 85 | 750 | 970 |
| Muddy Ck | |||||||
| Paonia Res, Bardine, Nr | March-June | 60 | 75 | 84 | 88 | 92 | 124 |
| April-July | 59 | 74 | 83 | 86 | 91 | 123 | |
| Nf Gunnison | |||||||
| Somerset, Nr | April-July | 195 | 220 | 245 | 83 | 275 | 370 |
| Surface Ck | |||||||
| Cedaredge | April-July | 8 | 12 | 13.5 | 80 | 16 | 20 |
| Uncompahgre | |||||||
| Ridgway Res | April-July | 75 | 88 | 97 | 96 | 106 | 135 |
| Colona | April-July | 95 | 117 | 130 | 95 | 150 | 200 |
| Delta | April-July | 70 | 93 | 106 | 94 | 121 | 180 |
| Gunnison | |||||||
| Grand Junction, Nr | April-July | 1000 | 1160 | 1280 | 86 | 1500 | 2000 |
| Forecast Period | 90% Exceedance Volume | 70% Exceedance Volume | 50% Exceedance Volume | Percent Average | 30% Exceedance Volume | 10% Exceedance Volume | |
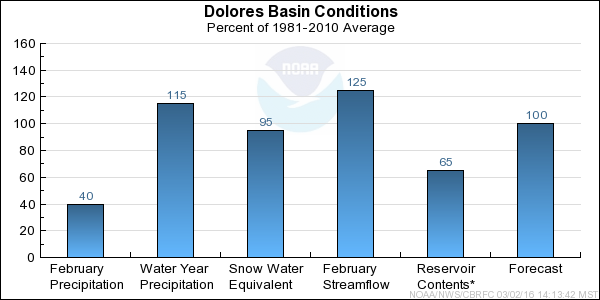
| Dolores | |||||||
| Dolores | April-July | 169 | 220 | 250 | 102 | 275 | 330 |
| Mcphee Res | April-July | 190 | 260 | 295 | 100 | 325 | 425 |
| San Miguel | |||||||
| Placerville, Nr | April-July | 95 | 120 | 135 | 105 | 152 | 188 |
| Dolores | |||||||
| Cisco, Nr | April-July | 360 | 500 | 570 | 101 | 650 | 880 |
| Range | Round to | |
| 0-1.99 | 0.01 | |
| 2.0-19.9 | 0.1 | |
| 20-199 | 1.0 | |
| 200-999 | 5.0 | |
| 1000+ | 3 significant digits |