NOAA, National Weather Service
Colorado Basin River Forecast Center
Salt Lake City, Utah
www.cbrfc.noaa.gov
| Prepared by Cody Moser, Greg Smith NOAA, National Weather Service Colorado Basin River Forecast Center Salt Lake City, Utah www.cbrfc.noaa.gov |
| Forecast Period | 90% Exceedance Volume | 70% Exceedance Volume | 50% Exceedance Volume | Percent Average | 30% Exceedance Volume | 10% Exceedance Volume | |
| Colorado | |||||||
| Lake Granby, Granby, Nr | April-July | 160 | 190 | 225 | 102 | 260 | 305 |
| Willow Ck | |||||||
| Willow Ck Res, Granby, Nr | April-July | 34 | 42 | 52 | 111 | 62 | 80 |
| Fraser | |||||||
| Winter Park | April-July | 14.5 | 17 | 19.5 | 101 | 22 | 24 |
| Williams Fork | |||||||
| Williams Fork Res, Parshall, Nr | April-July | 68 | 80 | 94 | 98 | 106 | 124 |
| Muddy Ck | |||||||
| Wolford Mountain Reservoir | April-July | 44 | 52 | 62 | 115 | 72 | 88 |
| Blue | |||||||
| Dillon Res | April-July | 135 | 160 | 180 | 110 | 200 | 220 |
| Green Mtn Res | April-July | 215 | 255 | 290 | 105 | 325 | 365 |
| Colorado | |||||||
| Kremmling, Nr | April-July | 660 | 780 | 900 | 105 | 1020 | 1210 |
| Eagle | |||||||
| Gypsum, Blo | April-July | 265 | 310 | 360 | 107 | 400 | 465 |
| Colorado | |||||||
| Dotsero, Nr | April-July | 1110 | 1280 | 1480 | 106 | 1700 | 2000 |
| Frying Pan | |||||||
| Ruedi Res, Basalt, Nr | April-July | 100 | 125 | 145 | 104 | 160 | 182 |
| Roaring Fork | |||||||
| Glenwood Springs | April-July | 530 | 620 | 700 | 101 | 780 | 880 |
| Colorado | |||||||
| Glenwood Springs, Blo | April-July | 1700 | 1980 | 2220 | 105 | 2520 | 2960 |
| Cameo, Nr | April-July | 1900 | 2220 | 2550 | 108 | 2850 | 3350 |
| Plateau Ck | |||||||
| Cameo, Nr | April-July | 120 | 145 | 165 | 133 | 185 | 210 |
| Colorado | |||||||
| Cisco, Nr | April-July | 3700 | 4300 | 4800 | 108 | 5300 | 6100 |
| Lake Powell, Glen Cyn Dam, At | April-July | 5300 | 6610 | 7300 | 102 | 8100 | 10700 |
| Forecast Period | 90% Exceedance Volume | 70% Exceedance Volume | 50% Exceedance Volume | Percent Average | 30% Exceedance Volume | 10% Exceedance Volume | |
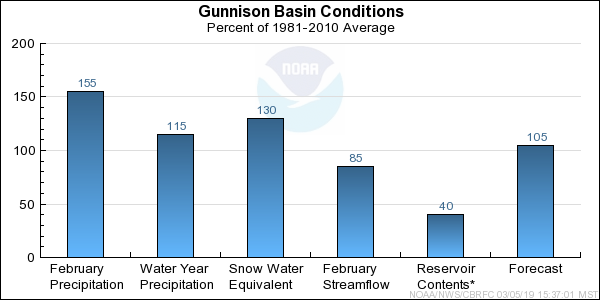
| Taylor | |||||||
| Taylor Park Res | April-July | 80 | 89 | 102 | 103 | 112 | 135 |
| Almont | April-July | 130 | 144 | 162 | 105 | 176 | 220 |
| East | |||||||
| Almont | April-July | 150 | 175 | 195 | 107 | 215 | 255 |
| Gunnison | |||||||
| Gunnison, Nr | April-July | 310 | 355 | 400 | 108 | 430 | 545 |
| Tomichi Ck | |||||||
| Gunnison | April-July | 50 | 68 | 80 | 108 | 91 | 121 |
| Lake Fork | |||||||
| Gateview | April-July | 94 | 119 | 135 | 110 | 155 | 185 |
| Gunnison | |||||||
| Blue Mesa Res | April-July | 570 | 660 | 740 | 110 | 820 | 1020 |
| Morrow Point Res | April-July | 640 | 730 | 810 | 109 | 890 | 1090 |
| Crystal Res | April-July | 725 | 815 | 895 | 107 | 975 | 1170 |
| Muddy Ck | |||||||
| Paonia Res, Bardine, Nr | March-June | 75 | 83 | 94 | 98 | 112 | 130 |
| April-July | 76 | 84 | 95 | 98 | 113 | 131 | |
| Nf Gunnison | |||||||
| Somerset, Nr | April-July | 240 | 260 | 290 | 98 | 320 | 410 |
| Surface Ck | |||||||
| Cedaredge | April-July | 17 | 20 | 23 | 137 | 25 | 28 |
| Uncompahgre | |||||||
| Ridgway Res | April-July | 66 | 88 | 98 | 97 | 105 | 136 |
| Colona | April-July | 89 | 120 | 130 | 95 | 145 | 195 |
| Delta | April-July | 59 | 90 | 105 | 93 | 120 | 175 |
| Gunnison | |||||||
| Grand Junction, Nr | April-July | 1180 | 1400 | 1520 | 103 | 1670 | 2200 |
| Forecast Period | 90% Exceedance Volume | 70% Exceedance Volume | 50% Exceedance Volume | Percent Average | 30% Exceedance Volume | 10% Exceedance Volume | |
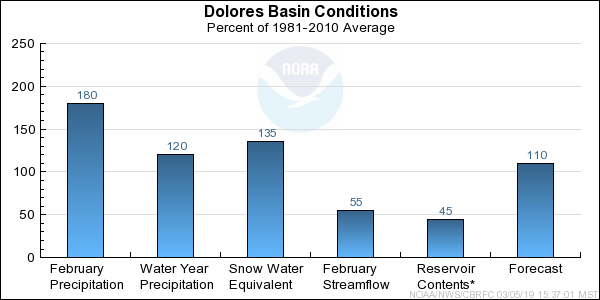
| Dolores | |||||||
| Dolores | April-July | 190 | 240 | 275 | 112 | 300 | 375 |
| Mcphee Res | April-July | 230 | 290 | 330 | 112 | 360 | 480 |
| San Miguel | |||||||
| Placerville, Nr | April-July | 82 | 109 | 120 | 94 | 140 | 168 |
| Dolores | |||||||
| Cisco, Nr | April-July | 410 | 540 | 600 | 106 | 680 | 885 |
| Range | Round to | |
| 0-1.99 | 0.01 | |
| 2.0-19.9 | 0.1 | |
| 20-199 | 1.0 | |
| 200-999 | 5.0 | |
| 1000+ | 3 significant digits |