
NOAA, National Weather Service
Colorado Basin River Forecast Center
Salt Lake City, Utah
www.cbrfc.noaa.gov
| Prepared by Cody Moser, Ashley Nielson NOAA, National Weather Service Colorado Basin River Forecast Center Salt Lake City, Utah www.cbrfc.noaa.gov |
| Forecast Period | 90% Exceedance Volume | 70% Exceedance Volume | 50% Exceedance Volume | Percent Average | 30% Exceedance Volume | 10% Exceedance Volume | |
| Colorado | |||||||
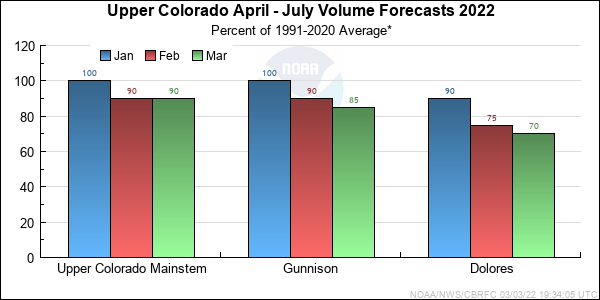
| Lake Granby, Granby, Nr | April-July | 160 | 190 | 210 | 93 | 230 | 255 |
| Willow Ck | |||||||
| Willow Ck Reservoir, Granby, Nr | April-July | 30 | 40 | 50 | 100 | 60 | 72 |
| Fraser | |||||||
| Winter Park | April-July | 13 | 15 | 17 | 91 | 19 | 21 |
| Williams Fork | |||||||
| Williams Fork Reservoir, Parshall | April-July | 55 | 65 | 75 | 78 | 85 | 100 |
| Muddy Ck | |||||||
| Wolford Mountain Reservoir | April-July | 20 | 27 | 36 | 69 | 44 | 55 |
| Blue | |||||||
| Dillon Reservoir | April-July | 105 | 125 | 140 | 84 | 160 | 180 |
| Green Mtn Reservoir | April-July | 180 | 220 | 245 | 88 | 270 | 320 |
| Colorado | |||||||
| Kremmling, Nr | April-July | 550 | 660 | 760 | 87 | 860 | 1000 |
| Eagle | |||||||
| Gypsum, Blo | April-July | 190 | 240 | 275 | 82 | 315 | 375 |
| Colorado | |||||||
| Dotsero, Nr | April-July | 900 | 1050 | 1200 | 86 | 1350 | 1600 |
| Frying Pan | |||||||
| Ruedi Reservoir, Basalt, Nr | April-July | 85 | 110 | 130 | 96 | 145 | 165 |
| Roaring Fork | |||||||
| Glenwood Springs | April-July | 470 | 540 | 600 | 92 | 660 | 770 |
| Colorado | |||||||
| Glenwood Springs, Blo | April-July | 1400 | 1600 | 1820 | 88 | 2000 | 2450 |
| Cameo, Nr | April-July | 1550 | 1800 | 2000 | 88 | 2300 | 2700 |
| Cisco, Nr | April-July | 2550 | 3000 | 3400 | 83 | 3800 | 4700 |
| Lake Powell, Glen Cyn Dam, At | April-July | 3100 | 3800 | 4400 | 69 | 5100 | 7000 |
| Forecast Period | 90% Exceedance Volume | 70% Exceedance Volume | 50% Exceedance Volume | Percent Average | 30% Exceedance Volume | 10% Exceedance Volume | |
| Taylor | |||||||
| Taylor Park Reservoir | April-July | 79 | 85 | 96 | 102 | 102 | 116 |
| Almont | April-July | 120 | 131 | 147 | 100 | 155 | 175 |
| East | |||||||
| Almont | April-July | 140 | 160 | 181 | 102 | 192 | 220 |
| Gunnison | |||||||
| Gunnison, Nr | April-July | 270 | 305 | 345 | 99 | 375 | 430 |
| Tomichi Ck | |||||||
| Gunnison | April-July | 28 | 38 | 47 | 70 | 54 | 76 |
| Lake Fork | |||||||
| Gateview | April-July | 72 | 85 | 93 | 79 | 103 | 135 |
| Gunnison | |||||||
| Blue Mesa Reservoir | April-July | 440 | 505 | 560 | 88 | 615 | 750 |
| Morrow Point Reservoir | April-July | 470 | 535 | 595 | 86 | 655 | 815 |
| Crystal Reservoir | April-July | 510 | 580 | 650 | 84 | 725 | 920 |
| Muddy Ck | |||||||
| Paonia Reservoir, Bardine, Nr | April-July | 50 | 60 | 70 | 86 | 79 | 97 |
| Nf Gunnison | |||||||
| Somerset, Nr | April-July | 180 | 205 | 230 | 87 | 250 | 290 |
| Surface Ck | |||||||
| Cedaredge | April-July | 10 | 12.6 | 15.3 | 105 | 17.1 | 20 |
| Uncompahgre | |||||||
| Ridgway Reservoir | April-July | 54 | 64 | 72 | 78 | 77 | 98 |
| Colona | April-July | 62 | 75 | 85 | 71 | 95 | 131 |
| Delta | April-July | 27 | 45 | 58 | 53 | 70 | 105 |
| Gunnison | |||||||
| Grand Junction, Nr | April-July | 860 | 980 | 1100 | 83 | 1180 | 1520 |
| Forecast Period | 90% Exceedance Volume | 70% Exceedance Volume | 50% Exceedance Volume | Percent Average | 30% Exceedance Volume | 10% Exceedance Volume | |
| Dolores | |||||||
| Dolores | April-July | 99 | 125 | 150 | 70 | 178 | 245 |
| Mcphee Reservoir | April-July | 110 | 143 | 168 | 66 | 197 | 285 |
| San Miguel | |||||||
| Placerville, Nr | April-July | 53 | 70 | 81 | 70 | 90 | 110 |
| Dolores | |||||||
| Cisco, Nr | April-July | 185 | 250 | 300 | 59 | 345 | 500 |
| Range | Round to | |
| 0-1.99 | 0.01 | |
| 2.0-19.9 | 0.1 | |
| 20-199 | 1.0 | |
| 200-999 | 5.0 | |
| 1000+ | 3 significant digits |

