NOAA, National Weather Service
Colorado Basin River Forecast Center
Salt Lake City, Utah
www.cbrfc.noaa.gov
| Prepared by Cody Moser, Ashley Nielson NOAA, National Weather Service Colorado Basin River Forecast Center Salt Lake City, Utah www.cbrfc.noaa.gov |
| Forecast Period | 90% Exceedance Volume | 70% Exceedance Volume | 50% Exceedance Volume | Percent Average | 30% Exceedance Volume | 10% Exceedance Volume | |
| Colorado | |||||||
| Lake Granby, Granby, Nr | April-July | 155 | 170 | 185 | 82 | 205 | 230 |
| May-July | 139 | 154 | 169 | 80 | 190 | 215 | |
| Willow Ck | |||||||
| Willow Ck Reservoir, Granby, Nr | April-July | 36 | 42 | 48 | 96 | 54 | 60 |
| May-July | 21 | 27 | 33 | 73 | 39 | 45 | |
| Fraser | |||||||
| Winter Park | April-July | 12 | 13.3 | 14.5 | 78 | 16 | 18 |
| May-July | 11 | 12.3 | 13.5 | 76 | 15 | 17 | |
| Williams Fork | |||||||
| Williams Fork Reservoir, Parshall | April-July | 54 | 62 | 68 | 71 | 75 | 83 |
| May-July | 46 | 54 | 60 | 67 | 67 | 75 | |
| Muddy Ck | |||||||
| Wolford Mountain Reservoir | April-July | 20 | 25 | 29 | 56 | 35 | 42 |
| May-July | 16 | 21 | 25 | 57 | 31 | 38 | |
| Blue | |||||||
| Dillon Reservoir | April-July | 105 | 117 | 128 | 77 | 140 | 155 |
| May-July | 97 | 109 | 120 | 77 | 132 | 147 | |
| Green Mtn Reservoir | April-July | 180 | 200 | 220 | 79 | 240 | 265 |
| May-July | 162 | 182 | 200 | 77 | 220 | 245 | |
| Colorado | |||||||
| Kremmling, Nr | April-July | 550 | 620 | 680 | 78 | 740 | 820 |
| May-July | 465 | 535 | 595 | 75 | 655 | 735 | |
| Eagle | |||||||
| Gypsum, Blo | April-July | 200 | 225 | 245 | 73 | 275 | 300 |
| May-July | 185 | 210 | 230 | 73 | 260 | 285 | |
| Colorado | |||||||
| Dotsero, Nr | April-July | 880 | 995 | 1080 | 77 | 1170 | 1280 |
| May-July | 755 | 870 | 955 | 75 | 1040 | 1150 | |
| Frying Pan | |||||||
| Ruedi Reservoir, Basalt, Nr | April-July | 90 | 100 | 110 | 81 | 120 | 135 |
| May-July | 82 | 92 | 102 | 81 | 112 | 127 | |
| Roaring Fork | |||||||
| Glenwood Springs | April-July | 460 | 510 | 550 | 84 | 590 | 640 |
| May-July | 410 | 460 | 500 | 83 | 540 | 590 | |
| Colorado | |||||||
| Glenwood Springs, Blo | April-July | 1400 | 1550 | 1680 | 81 | 1800 | 1940 |
| May-July | 1220 | 1370 | 1500 | 79 | 1620 | 1760 | |
| Cameo, Nr | April-July | 1500 | 1660 | 1800 | 79 | 1950 | 2100 |
| May-July | 1310 | 1470 | 1610 | 78 | 1760 | 1910 | |
| Cisco, Nr | April-July | 2400 | 2700 | 2980 | 73 | 3300 | 3600 |
| May-July | 1980 | 2280 | 2560 | 72 | 2880 | 3180 | |
| Lake Powell, Glen Cyn Dam, At | April-July | 2790 | 3290 | 3800 | 59 | 4330 | 5090 |
| May-July | 2200 | 2700 | 3210 | 58 | 3740 | 4500 |
| Forecast Period | 90% Exceedance Volume | 70% Exceedance Volume | 50% Exceedance Volume | Percent Average | 30% Exceedance Volume | 10% Exceedance Volume | |
| Taylor | |||||||
| Taylor Park Reservoir | April-July | 79 | 85 | 90 | 96 | 96 | 107 |
| May-July | 71 | 77 | 82 | 96 | 88 | 99 | |
| Almont | April-July | 114 | 126 | 136 | 93 | 142 | 156 |
| May-July | 103 | 115 | 125 | 95 | 131 | 145 | |
| East | |||||||
| Almont | April-July | 140 | 154 | 164 | 93 | 174 | 191 |
| May-July | 124 | 138 | 148 | 92 | 158 | 175 | |
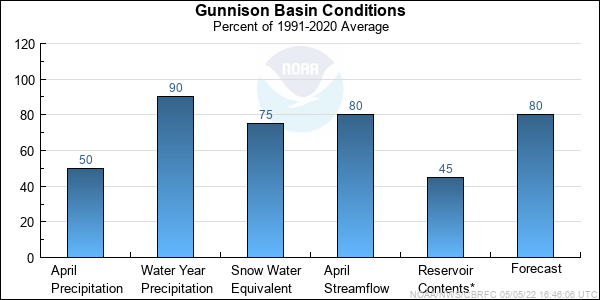
| Gunnison | |||||||
| Gunnison, Nr | April-July | 265 | 290 | 315 | 90 | 335 | 360 |
| May-July | 235 | 260 | 285 | 90 | 305 | 330 | |
| Tomichi Ck | |||||||
| Gunnison | April-July | 31 | 36 | 40 | 60 | 45 | 59 |
| May-July | 22 | 27 | 31 | 56 | 36 | 50 | |
| Lake Fork | |||||||
| Gateview | April-July | 60 | 69 | 78 | 66 | 86 | 100 |
| May-July | 54 | 63 | 72 | 65 | 80 | 94 | |
| Gunnison | |||||||
| Blue Mesa Reservoir | April-July | 405 | 450 | 490 | 77 | 520 | 590 |
| May-July | 345 | 390 | 430 | 77 | 460 | 530 | |
| Morrow Point Reservoir | April-July | 430 | 475 | 515 | 75 | 545 | 620 |
| May-July | 365 | 410 | 450 | 75 | 480 | 555 | |
| Crystal Reservoir | April-July | 465 | 520 | 560 | 73 | 600 | 685 |
| May-July | 390 | 445 | 485 | 72 | 525 | 610 | |
| Muddy Ck | |||||||
| Paonia Reservoir, Bardine, Nr | April-July | 50 | 56 | 61 | 75 | 68 | 79 |
| May-July | 35 | 41 | 46 | 74 | 53 | 64 | |
| Nf Gunnison | |||||||
| Somerset, Nr | April-July | 187 | 200 | 220 | 83 | 235 | 260 |
| May-July | 139 | 154 | 170 | 79 | 185 | 210 | |
| Surface Ck | |||||||
| Cedaredge | April-July | 10.6 | 12.2 | 13.5 | 92 | 14.9 | 16.9 |
| May-July | 7.5 | 9.1 | 10.4 | 86 | 11.8 | 13.8 | |
| Uncompahgre | |||||||
| Ridgway Reservoir | April-July | 50 | 57 | 62 | 67 | 67 | 77 |
| May-July | 43 | 50 | 55 | 66 | 60 | 70 | |
| Colona | April-July | 51 | 62 | 70 | 58 | 77 | 96 |
| May-July | 43 | 54 | 62 | 58 | 69 | 88 | |
| Delta | April-July | 25 | 37 | 47 | 49 | 62 | 77 |
| May-July | 18 | 30 | 40 | 49 | 55 | 70 | |
| Gunnison | |||||||
| Grand Junction, Nr | April-July | 780 | 855 | 950 | 71 | 1020 | 1170 |
| May-July | 610 | 685 | 780 | 70 | 850 | 1000 |
| Forecast Period | 90% Exceedance Volume | 70% Exceedance Volume | 50% Exceedance Volume | Percent Average | 30% Exceedance Volume | 10% Exceedance Volume | |
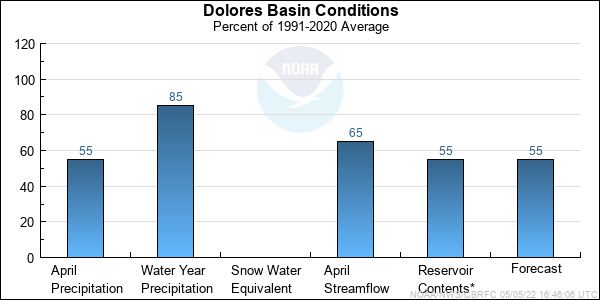
| Dolores | |||||||
| Dolores | April-July | 100 | 113 | 130 | 60 | 148 | 169 |
| May-July | 65 | 78 | 95 | 54 | 113 | 134 | |
| Mcphee Reservoir | April-July | 110 | 122 | 136 | 53 | 156 | 176 |
| May-July | 69 | 81 | 95 | 49 | 115 | 135 | |
| San Miguel | |||||||
| Placerville, Nr | April-July | 49 | 55 | 61 | 53 | 68 | 78 |
| May-July | 41 | 47 | 53 | 52 | 60 | 70 | |
| Dolores | |||||||
| Cisco, Nr | April-July | 156 | 183 | 220 | 44 | 255 | 290 |
| May-July | 85 | 112 | 150 | 39 | 182 | 220 |
| Range | Round to | |
| 0-1.99 | 0.01 | |
| 2.0-19.9 | 0.1 | |
| 20-199 | 1.0 | |
| 200-999 | 5.0 | |
| 1000+ | 3 significant digits |