NOAA, National Weather Service
Colorado Basin River Forecast Center
Salt Lake City, Utah
www.cbrfc.noaa.gov
| Prepared by G. Smith NOAA, National Weather Service Colorado Basin River Forecast Center Salt Lake City, Utah www.cbrfc.noaa.gov |
| Forecast Period | 90% Exceedance Volume | 50% Exceedance Volume | Percent Median | 10% Exceedance Volume | |
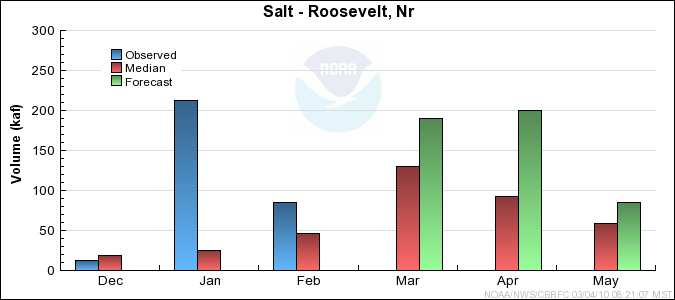
| Salt | |||||
| Roosevelt, Nr | March-May | 270 | 475 | 176 | 765 |
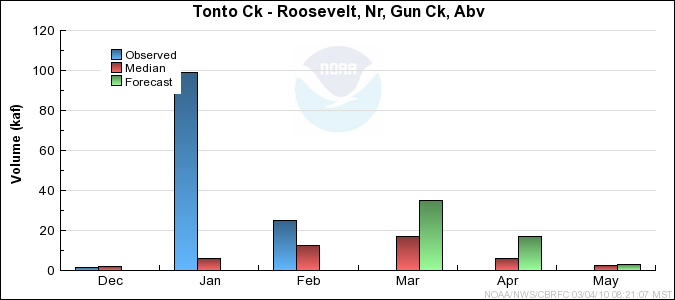
| Tonto Ck | |||||
| Roosevelt, Nr, Gun Ck, Abv | March-May | 17 | 55 | 212 | 129 |
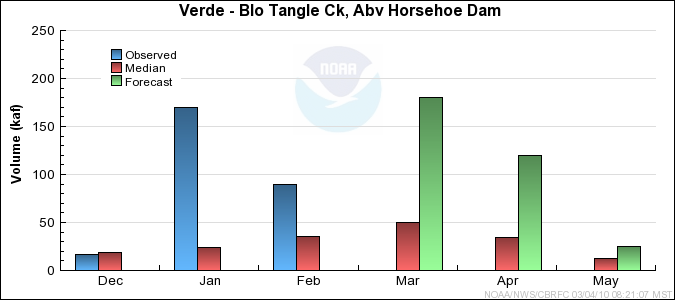
| Verde | |||||
| Blo Tangle Ck, Abv Horsehoe Dam | March-May | 158 | 320 | 222 | 565 |
| Forecast Period | 90% Exceedance Volume | 50% Exceedance Volume | Percent Median | 10% Exceedance Volume | |
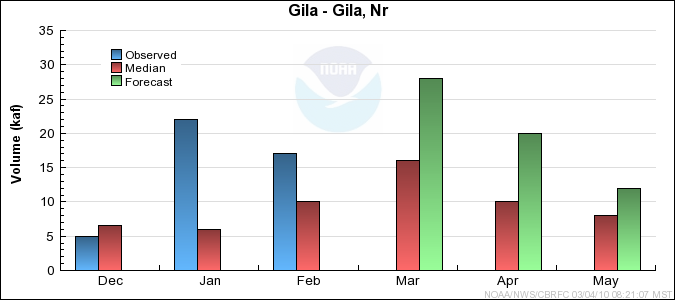
| Gila | |||||
| Gila, Nr | March-May | 46 | 60 | 176 | 90 |
| Virden, Nr, Blue Ck, Blo | March-May | 60 | 81 | 172 | 114 |
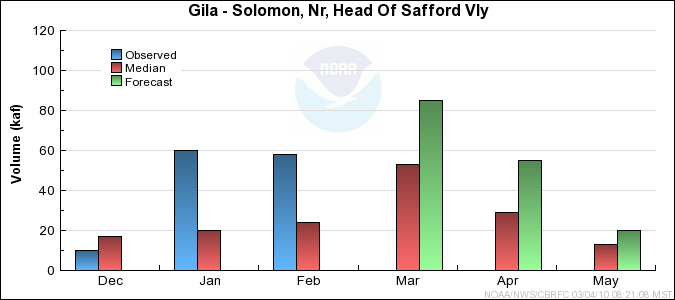
| Solomon, Nr, Head Of Safford Vly | March-May | 114 | 160 | 152 | 225 |
| San Carlos Res, Coolidge Dam, At | March-May | 64 | 110 | 172 | 162 |
| San Francisco | |||||
| Glenwood, Nr | March-May | 21 | 40 | 244 | 69 |
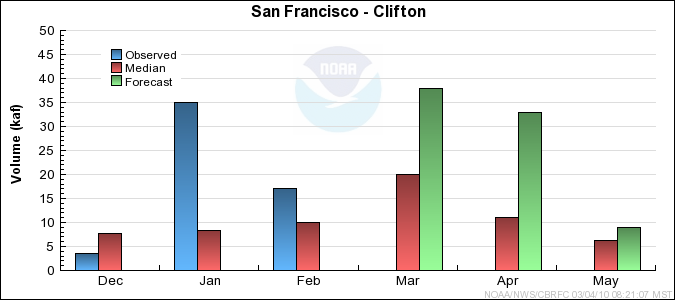
| Clifton | March-May | 51 | 80 | 190 | 109 |
| Forecast Period | 90% Exceedance Volume | 50% Exceedance Volume | Percent Median | 10% Exceedance Volume | |
| Little Colorado | |||||
| Lyman Lk, Abv, St. Johns, Nr | March-June | 6 | 14 | 222 | 26 |
| Woodruff | March-May | 1.4 | 5 | 227 | 8.8 |
| Rio Nutria | |||||
| Ramah, Nr | March-May | 1.8 | 6 | 222 | 14 |
| Zuni | |||||
| Black Rock Res, Abv | March-May | 0.75 | 5 | 562 | 14.6 |
| Cebolla Ck | |||||
| Ramah Res | March-May | 1 | 3.3 | 221 | 7.2 |
| East Clear Ck | |||||
| Blue Ridge Res, Pine, Nr | March-May | 12.8 | 28 | 219 | 45 |
| Clear Ck | |||||
| Winslow, Nr | March-May | 27 | 48 | 155 | 80 |
| Chevelon Ck | |||||
| Winslow, Nr, Wildcat Cyn, Blo | March-May | 18 | 35 | 267 | 57 |
| Walnut Ck | |||||
| Lake Mary | March-May | 6.7 | 12 | 293 | 19.6 |
| Usable Capacity | EOM Contents | Percent Usable Capacity | Last Year EOM | Last Year %Capacity | |
| Salt | |||||
| Roosevelt | 1653.0 | 1644.3 | 99 | 1653.0 | 100 |
| Horse Mesa | 245.0 | 229.5 | 94 | 240.4 | 98 |
| Mormon Flat | 58.0 | 55.0 | 95 | 56.2 | 97 |
| Stewart Mountain | 70.0 | 64.3 | 92 | 66.7 | 95 |
| Horseshoe | 109.2 | 97.0 | 89 | 62.2 | 57 |
| Bartlett | 178.0 | 164.4 | 92 | 141.3 | 79 |
|
| |||||
| TOTAL | 2313.2 | 2254.4 | 97 | 2219.9 | 96 |
| Little Colorado | |||||
| Lyman Lake | 31.0 | 12.8 | 41 | 14.5 | 47 |
| Bill Williams | |||||
| Alamo | 1045.0 | 200.6 | 19 | 162.3 | 16 |
| Agua Fria | |||||
| Lake Pleasant | 1145.0 | 773.5 | 68 | 697.0 | 61 |
| Gila | |||||
| San Carlos | 885.0 | 172.5 | 19 | 227.8 | 26 |
| Painted Rock | 2476.0 | 1.3 | 0 | 0.0 | 0 |
| Colorado | |||||
| Lake Powell | 24322.0 | 13780.2 | 57 | 12937.8 | 53 |
| Lake Mead | 27380.0 | 11774.0 | 43 | 12533.0 | 46 |
| Lake Mohave | 1810.0 | 1680.4 | 93 | 1675.2 | 93 |
| Lake Havasu | 619.0 | 547.5 | 88 | 541.8 | 88 |
|
| |||||
| TOTAL | 59713.0 | 28942.9 | 48 | 28789.4 | 48 |
| Range | Round to | |
| 0-1.99 | 0.01 | |
| 2.0-19.9 | 0.1 | |
| 20-199 | 1.0 | |
| 200-999 | 5.0 | |
| 1000+ | 3 significant digits |