NOAA, National Weather Service
Colorado Basin River Forecast Center
Salt Lake City, Utah
www.cbrfc.noaa.gov
| Prepared by B.Bernard NOAA, National Weather Service Colorado Basin River Forecast Center Salt Lake City, Utah www.cbrfc.noaa.gov |
| Forecast Period | 90% Exceedance Volume | 50% Exceedance Volume | Percent Average | 10% Exceedance Volume | |
| Bear | |||||
| Utah | April-July | 111 | 154 | 136 | 200 |
| Woodruff Narrows Res * | April-July | 111 | 185 | 136 | 285 |
| Montpelier, Nr, Stewart Dam, Blo * | April-July | 140 | 310 | 132 | 535 |
| Big Ck | |||||
| Randolph, Nr | April-July | 4.4 | 7 | 146 | 9.6 |
| Smiths Fork | |||||
| Border, Nr | April-July | 84 | 130 | 126 | 176 |
| Logan | |||||
| Logan, Nr, State Dam, Abv | April-July | 115 | 165 | 131 | 220 |
| Blacksmith Fork | |||||
| Hyrum, Nr, Upnl Dam, Abv | April-July | 40 | 70 | 146 | 100 |
| Little Bear | |||||
| Paradise | April-July | 38 | 68 | 148 | 108 |
| Forecast Period | 90% Exceedance Volume | 50% Exceedance Volume | Percent Average | 10% Exceedance Volume | |
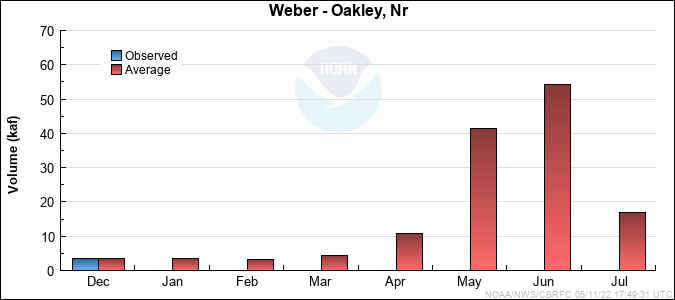
| Weber | |||||
| Oakley, Nr | April-July | 117 | 165 | 134 | 225 |
| Rockport Res, Wanship, Nr | April-July | 118 | 180 | 130 | 265 |
| Coalville, Nr | April-July | 122 | 195 | 141 | 290 |
| Chalk Ck | |||||
| Coalville | April-July | 38 | 64 | 142 | 101 |
| Weber | |||||
| Echo Res, Echo, At | April-July | 163 | 255 | 142 | 400 |
| Lost Ck | |||||
| Lost Ck Res, Croydon, Nr | April-July | 12 | 23 | 131 | 43 |
| East Canyon Ck | |||||
| Jeremy Ranch, Nr | April-July | 13 | 20 | 141 | 31 |
| East Canyon Res, Morgan, Nr | April-July | 25 | 44 | 142 | 66 |
| Weber | |||||
| Gateway | April-July | 285 | 510 | 144 | 795 |
| Sf Ogden | |||||
| Huntsville, Nr | April-July | 48 | 85 | 133 | 120 |
| Ogden | |||||
| Pineview Res, Ogden, Nr | April-July | 100 | 180 | 135 | 260 |
| Wheeler Ck | |||||
| Huntsville, Nr | April-July | 6.8 | 9.6 | 152 | 12.4 |
| Centerville Ck | |||||
| Centerville,nr, Div,abv | April-July | 1.3 | 2 | 113 | 2.7 |
| Forecast Period | 90% Exceedance Volume | 50% Exceedance Volume | Percent Average | 10% Exceedance Volume | |
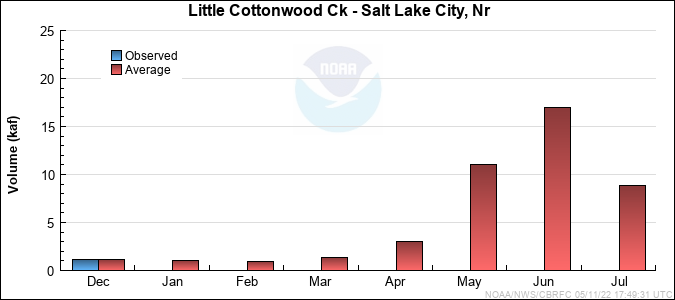
| Little Cottonwood Ck | |||||
| Salt Lake City, Nr | April-July | 35 | 48 | 120 | 62 |
| Big Cottonwood Ck | |||||
| Salt Lake City, Nr | April-July | 29 | 46 | 121 | 62 |
| Mill Ck | |||||
| Salt Lake City, Nr | April-July | 5 | 8.5 | 121 | 12 |
| Dell Fk | |||||
| Little Dell Res | April-July | 5 | 8 | 118 | 11 |
| Parleys Ck | |||||
| Salt Lake City, Nr | April-July | 11 | 20 | 120 | 30 |
| Emigration Ck | |||||
| Salt Lake City, Nr | April-July | 2 | 5.3 | 118 | 9 |
| City Ck | |||||
| Salt Lake City, Nr | April-July | 8 | 11.5 | 132 | 17 |
| Vernon Ck | |||||
| Vernon, Nr | April-June | 0.83 | 2.2 | 149 | 3.6 |
| S Willow Ck | |||||
| Grantsville, Nr | April-July | 3.4 | 5 | 156 | 6.6 |
| Dunn Ck | |||||
| Park Valley, Nr | April-July | 0.2 | 4.2 | 135 | 8.2 |
| Forecast Period | 90% Exceedance Volume | 50% Exceedance Volume | Percent Average | 10% Exceedance Volume | |
| Spanish Fork | |||||
| Castilla, Nr | April-July | 73 | 125 | 162 | 205 |
| Provo | |||||
| Woodland, Nr | April-July | 101 | 145 | 141 | 192 |
| Hailstone, Nr | April-July | 104 | 155 | 142 | 210 |
| Deer Ck Res | April-July | 120 | 190 | 151 | 300 |
| American Fork | |||||
| American Fork, Nr, Up Pwrplnt, Abv | April-July | 29 | 48 | 150 | 71 |
| West Canyon Ck | |||||
| Cedar Fort, Nr | April-July | 2 | 3.2 | 139 | 6 |
| Salt Ck | |||||
| Nephi | April-July | 7.7 | 15 | 114 | 22 |
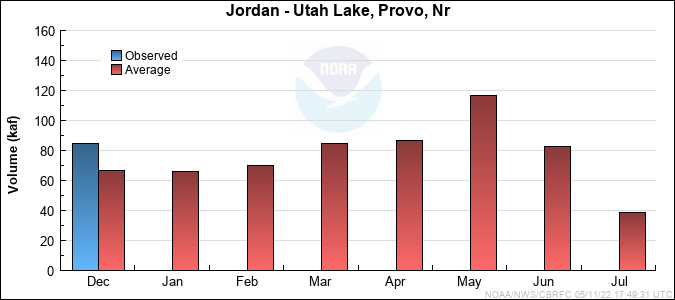
| Jordan | |||||
| Utah Lake, Provo, Nr | April-July | 345 | 530 | 161 | 810 |
| Range | Round to | |
| 0-1.99 | 0.01 | |
| 2.0-19.9 | 0.1 | |
| 20-199 | 1.0 | |
| 200-999 | 5.0 | |
| 1000+ | 3 significant digits |