NOAA, National Weather Service
Colorado Basin River Forecast Center
Salt Lake City, Utah
www.cbrfc.noaa.gov
| Prepared by B.Bernard NOAA, National Weather Service Colorado Basin River Forecast Center Salt Lake City, Utah www.cbrfc.noaa.gov |
| Forecast Period | 90% Exceedance Volume | 50% Exceedance Volume | Percent Average | 10% Exceedance Volume | |
| Bear | |||||
| Utah | April-July | 45 | 65 | 58 | 88 |
| Woodruff Narrows Res * | April-July | 31 | 68 | 50 | 78 |
| Montpelier, Nr, Stewart Dam, Blo * | April-July | 21 | 35 | 14.9 | 71 |
| Big Ck | |||||
| Randolph, Nr | April-July | 0.72 | 2.5 | 52 | 4.3 |
| Smiths Fork | |||||
| Border, Nr | April-July | 26 | 55 | 53 | 74 |
| Logan | |||||
| Logan, Nr, State Dam, Abv | April-July | 48 | 60 | 48 | 82 |
| Blacksmith Fork | |||||
| Hyrum, Nr, Upnl Dam, Abv | April-July | 16 | 23 | 48 | 27 |
| Little Bear | |||||
| Paradise | April-July | 12 | 20 | 43 | 26 |
| Forecast Period | 90% Exceedance Volume | 50% Exceedance Volume | Percent Average | 10% Exceedance Volume | |
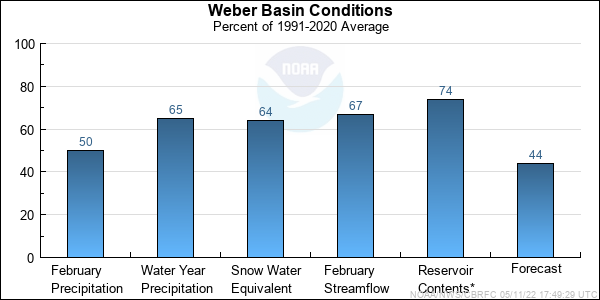
| Weber | |||||
| Oakley, Nr | April-July | 50 | 69 | 56 | 95 |
| Rockport Res, Wanship, Nr | April-July | 36 | 70 | 52 | 84 |
| Coalville, Nr | April-July | 31 | 62 | 45 | 75 |
| Chalk Ck | |||||
| Coalville | April-July | 9 | 20 | 44 | 26 |
| Weber | |||||
| Echo Res, Echo, At | April-July | 49 | 80 | 45 | 123 |
| Lost Ck | |||||
| Lost Ck Res, Croydon, Nr | April-July | 3 | 5 | 28 | 8 |
| East Canyon Ck | |||||
| Jeremy Ranch, Nr | April-July | 4 | 6 | 42 | 9 |
| East Canyon Res, Morgan, Nr | April-July | 8 | 13 | 42 | 20 |
| Weber | |||||
| Gateway | April-July | 69 | 150 | 42 | 205 |
| Sf Ogden | |||||
| Huntsville, Nr | April-July | 11 | 27 | 42 | 37 |
| Ogden | |||||
| Pineview Res, Ogden, Nr | April-July | 36 | 55 | 41 | 102 |
| Wheeler Ck | |||||
| Huntsville, Nr | April-July | 0.25 | 2.5 | 40 | 5.9 |
| Centerville Ck | |||||
| Centerville,nr, Div,abv | April-July | 0.18 | 0.4 | 23 | 1.2 |
| Forecast Period | 90% Exceedance Volume | 50% Exceedance Volume | Percent Average | 10% Exceedance Volume | |
| Little Cottonwood Ck | |||||
| Salt Lake City, Nr | April-July | 21 | 27 | 68 | 37 |
| Big Cottonwood Ck | |||||
| Salt Lake City, Nr | April-July | 16 | 23 | 61 | 34 |
| Mill Ck | |||||
| Salt Lake City, Nr | April-July | 3 | 3.6 | 51 | 6 |
| Dell Fk | |||||
| Little Dell Res | April-July | 2 | 3 | 44 | 5 |
| Parleys Ck | |||||
| Salt Lake City, Nr | April-July | 5 | 8 | 48 | 13 |
| Emigration Ck | |||||
| Salt Lake City, Nr | April-July | 1 | 2 | 44 | 3 |
| City Ck | |||||
| Salt Lake City, Nr | April-July | 3 | 4.6 | 53 | 7 |
| Vernon Ck | |||||
| Vernon, Nr | April-June | 0.03 | 0.8 | 54 | 1.4 |
| S Willow Ck | |||||
| Grantsville, Nr | April-July | 1.5 | 2.1 | 66 | 3 |
| Dunn Ck | |||||
| Park Valley, Nr | April-July | 0.28 | 1.4 | 45 | 3.9 |
| Forecast Period | 90% Exceedance Volume | 50% Exceedance Volume | Percent Average | 10% Exceedance Volume | |
| Spanish Fork | |||||
| Castilla, Nr | April-July | 30 | 43 | 56 | 51 |
| Provo | |||||
| Woodland, Nr | April-July | 48 | 65 | 63 | 87 |
| Hailstone, Nr | April-July | 44 | 68 | 62 | 87 |
| Deer Ck Res | April-July | 40 | 66 | 52 | 82 |
| American Fork | |||||
| American Fork, Nr, Up Pwrplnt, Abv | April-July | 11 | 16 | 50 | 22 |
| West Canyon Ck | |||||
| Cedar Fort, Nr | April-July | 0.2 | 1 | 43 | 2 |
| - | 0 | 0 | 0 | 0 | |
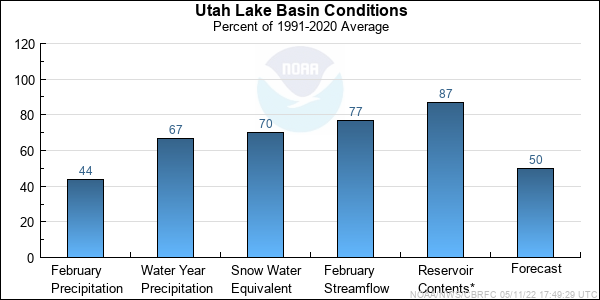
| Jordan | |||||
| Utah Lake, Provo, Nr | April-July | 113 | 155 | 47 | 225 |
| Range | Round to | |
| 0-1.99 | 0.01 | |
| 2.0-19.9 | 0.1 | |
| 20-199 | 1.0 | |
| 200-999 | 5.0 | |
| 1000+ | 3 significant digits |