NOAA, National Weather Service
Colorado Basin River Forecast Center
Salt Lake City, Utah
www.cbrfc.noaa.gov
| Prepared by B.Bernard NOAA, National Weather Service Colorado Basin River Forecast Center Salt Lake City, Utah www.cbrfc.noaa.gov |
| Forecast Period | 90% Exceedance Volume | 50% Exceedance Volume | Percent Average | 10% Exceedance Volume | |
| Bear | |||||
| Utah | April-July | 153 | 170 | 150 | 197 |
| Woodruff Narrows Res * | April-July | 180 | 205 | 151 | 265 |
| Montpelier, Nr, Stewart Dam, Blo * | April-July | 305 | 380 | 162 | 490 |
| Big Ck | |||||
| Randolph, Nr | April-July | 6.9 | 9 | 188 | 11.1 |
| Smiths Fork | |||||
| Border, Nr | April-July | 121 | 142 | 138 | 160 |
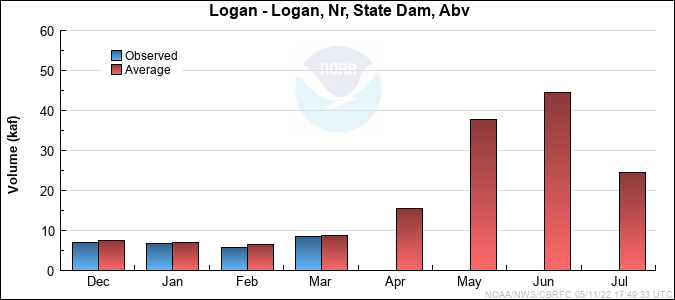
| Logan | |||||
| Logan, Nr, State Dam, Abv | April-July | 170 | 190 | 151 | 210 |
| Blacksmith Fork | |||||
| Hyrum, Nr, Upnl Dam, Abv | April-July | 81 | 90 | 188 | 106 |
| Little Bear | |||||
| Paradise | April-July | 72 | 82 | 178 | 100 |
| Forecast Period | 90% Exceedance Volume | 50% Exceedance Volume | Percent Average | 10% Exceedance Volume | |
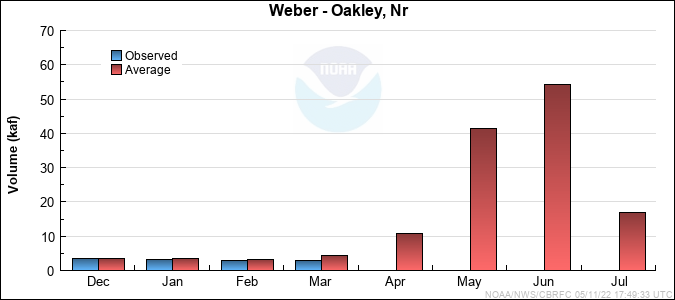
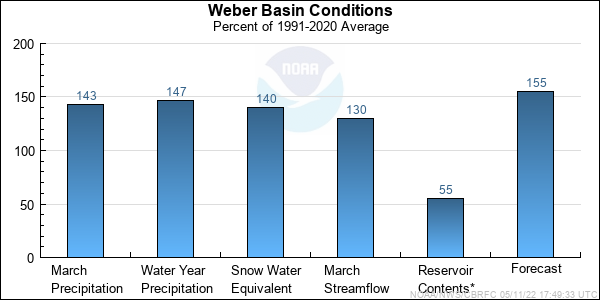
| Weber | |||||
| Oakley, Nr | April-July | 165 | 180 | 146 | 210 |
| Rockport Res, Wanship, Nr | April-July | 175 | 195 | 141 | 235 |
| Coalville, Nr | April-July | 189 | 210 | 152 | 255 |
| Chalk Ck | |||||
| Coalville | April-July | 62 | 72 | 160 | 95 |
| Weber | |||||
| Echo Res, Echo, At | April-July | 250 | 280 | 156 | 345 |
| Lost Ck | |||||
| Lost Ck Res, Croydon, Nr | April-July | 22 | 27 | 153 | 36 |
| East Canyon Ck | |||||
| Jeremy Ranch, Nr | April-July | 22 | 25 | 176 | 30 |
| East Canyon Res, Morgan, Nr | April-July | 47 | 54 | 174 | 66 |
| Weber | |||||
| Gateway | April-July | 515 | 590 | 166 | 730 |
| Sf Ogden | |||||
| Huntsville, Nr | April-July | 91 | 105 | 164 | 131 |
| Ogden | |||||
| Pineview Res, Ogden, Nr | April-July | 185 | 215 | 162 | 265 |
| Wheeler Ck | |||||
| Huntsville, Nr | April-July | 7.2 | 10 | 159 | 12.8 |
| Centerville Ck | |||||
| Centerville,nr, Div,abv | April-July | 2.2 | 2.7 | 153 | 3.2 |
| Forecast Period | 90% Exceedance Volume | 50% Exceedance Volume | Percent Average | 10% Exceedance Volume | |
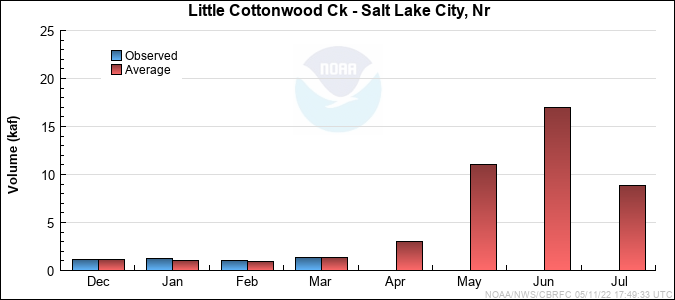
| Little Cottonwood Ck | |||||
| Salt Lake City, Nr | April-July | 47 | 53 | 133 | 60 |
| Big Cottonwood Ck | |||||
| Salt Lake City, Nr | April-July | 44 | 50 | 132 | 59 |
| Mill Ck | |||||
| Salt Lake City, Nr | April-July | 8.2 | 9.5 | 136 | 11.7 |
| Dell Fk | |||||
| Little Dell Res | April-July | 9.6 | 11 | 162 | 14 |
| Parleys Ck | |||||
| Salt Lake City, Nr | April-July | 22 | 26 | 156 | 34 |
| Emigration Ck | |||||
| Salt Lake City, Nr | April-July | 6.1 | 7.2 | 160 | 9.2 |
| City Ck | |||||
| Salt Lake City, Nr | April-July | 12.5 | 14 | 161 | 16.7 |
| Vernon Ck | |||||
| Vernon, Nr | April-June | 1.4 | 2.4 | 162 | 3.4 |
| S Willow Ck | |||||
| Grantsville, Nr | April-July | 4.2 | 5 | 156 | 6.3 |
| Dunn Ck | |||||
| Park Valley, Nr | April-July | 2.8 | 6 | 194 | 9.2 |
| Forecast Period | 90% Exceedance Volume | 50% Exceedance Volume | Percent Average | 10% Exceedance Volume | |
| Spanish Fork | |||||
| Castilla, Nr | April-July | 110 | 120 | 156 | 151 |
| Provo | |||||
| Woodland, Nr | April-July | 140 | 155 | 150 | 175 |
| Hailstone, Nr | April-July | 150 | 165 | 151 | 188 |
| Deer Ck Res | April-July | 180 | 200 | 159 | 230 |
| American Fork | |||||
| American Fork, Nr, Up Pwrplnt, Abv | April-July | 49 | 55 | 172 | 64 |
| West Canyon Ck | |||||
| Cedar Fort, Nr | April-July | 2.6 | 3.5 | 152 | 4.4 |
| Salt Ck | |||||
| Nephi | April-July | 8.8 | 15.5 | 117 | 22 |
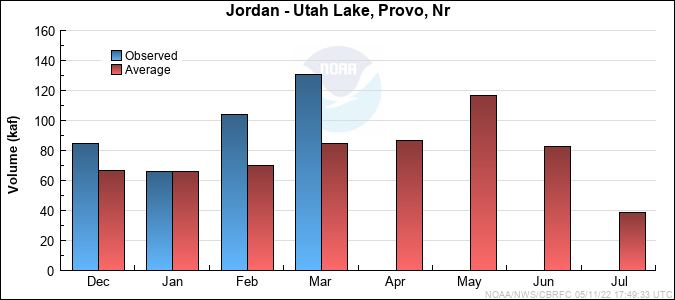
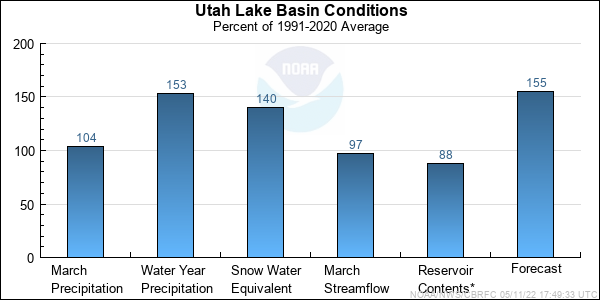
| Jordan | |||||
| Utah Lake, Provo, Nr | April-July | 505 | 570 | 173 | 680 |
| Range | Round to | |
| 0-1.99 | 0.01 | |
| 2.0-19.9 | 0.1 | |
| 20-199 | 1.0 | |
| 200-999 | 5.0 | |
| 1000+ | 3 significant digits |