NOAA, National Weather Service
Colorado Basin River Forecast Center
Salt Lake City, Utah
www.cbrfc.noaa.gov
| Prepared by Brent Bernard NOAA, National Weather Service Colorado Basin River Forecast Center Salt Lake City, Utah www.cbrfc.noaa.gov |

| Forecast Period | 90% Exceedance Volume | 50% Exceedance Volume | Percent Average | 10% Exceedance Volume | |
| Mammoth Ck | |||||
| West Hatch Ditch, Abv | April-July | 49 | 61 | 235 | 73 |
| June-July | 26 | 37 | 272 | 48 | |
| Sevier | |||||
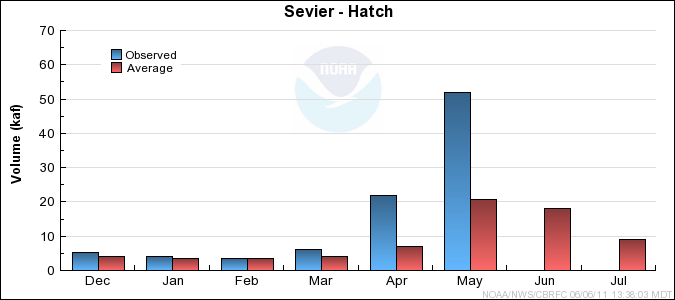
| Hatch | April-July | 138 | 144 | 262 | 150 |
| June-July | 66 | 70 | 259 | 74 | |
| Kingston, Nr * | April-July | 115 | 140 | 424 | 152 |
| June-July | 49 | 62 | 449 | 74 | |
| Ef Sevier | |||||
| Kingston, Nr * | April-July | 70 | 77 | 220 | 84 |
| June-July | 35 | 40 | 214 | 45 | |
| Sevier | |||||
| Piute Dam, Blo, Marysvale, Nr * | April-July | 200 | 225 | 341 | 250 |
| June-July | 80 | 102 | 319 | 127 | |
| Clear Ck | |||||
| Sevier, Nr, Diversions, Abv | April-July | 45 | 48 | 218 | 51 |
| June-July | 19.7 | 22 | 227 | 24 | |
| Salina Ck | |||||
| Emery, Nr | April-July | 14.9 | 17 | 189 | 19.1 |
| June-July | 10.5 | 11.6 | 305 | 12.7 | |
| Salina | April-July | 35 | 42 | 213 | 50 |
| June-July | 13 | 17.3 | 270 | 22 | |
| Manti Ck | |||||
| Manti, Nr, Dugway Ck, Blo | April-July | 23 | 25 | 137 | 27 |
| June-July | 16 | 18.4 | 170 | 21 | |
| Sevier | |||||
| Gunnison, Nr, San Pitch, Blo * | April-July | 285 | 315 | 297 | 345 |
| June-July | 145 | 160 | 314 | 175 | |
| Chicken Ck | |||||
| Levan, Nr | April-July | 5.8 | 6.9 | 153 | 8.1 |
| June-July | 1.5 | 2.5 | 202 | 3.8 | |
| Oak Ck | |||||
| Oak City, Nr, Little Ck, Abv | April-July | 1.8 | 2.2 | 133 | 2.7 |
| June-July | 0.38 | 0.68 | 219 | 1.1 | |
| Beaver | |||||
| Beaver, Nr | April-July | 45 | 50 | 185 | 55 |
| June-July | 26 | 33 | 224 | 41 | |
| Minersville Res, Minersville, Nr | April-July | 27 | 34 | 205 | 42 |
| June-July | 21 | 26 | 277 | 31 | |
| Coal Ck | |||||
| Cedar City, Nr | April-July | 39 | 42 | 218 | 45 |
| June-July | 13.6 | 18 | 277 | 22 |
| Usable Capacity | EOM Contents | Percent Usable Capacity | Last Year EOM | Last Year %Capacity | |
|
| |||||
| Otter Creek Res, Antimony, Nr | 52.5 | 52.5 | 100 | 37.4 | 71 |
|
| |||||
| Piute Res, Marysvale, Nr | 71.8 | 66.1 | 92 | 37.7 | 53 |
|
| |||||
| 20.3 | 16.9 | 83 | 15.2 | 75 | |
|
| |||||
| 236.0 | 205.1 | 87 | 103.6 | 44 | |
|
| |||||
| Minersville Res, Minersville, Nr | 23.3 | 21.0 | 90 | 9.4 | 40 |
|
| |||||
| TOTAL | 403.9 | 361.6 | 90 | 203.3 | 50 |
| Range | Round to | |
| 0-1.99 | 0.01 | |
| 2.0-19.9 | 0.1 | |
| 20-199 | 1.0 | |
| 200-999 | 5.0 | |
| 1000+ | 3 significant digits |