Note: This publication is currently undergoing major revisions. The current publication will be replaced with a new publication based on stakeholder requirements and scientific advances. We expect to begin sharing details on this soon. If you have input on content, format, or publication frequency at any time, please contact us at cbrfc.webmasters@noaa.gov.Great Basin Water Supply Outlook, April 1, 2011Great Basin Water Supply Outlook, April 1, 2011
Contents
Great Basin Summary
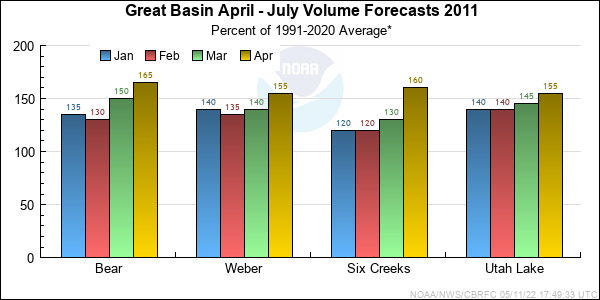
*Median of forecasts within each basin.
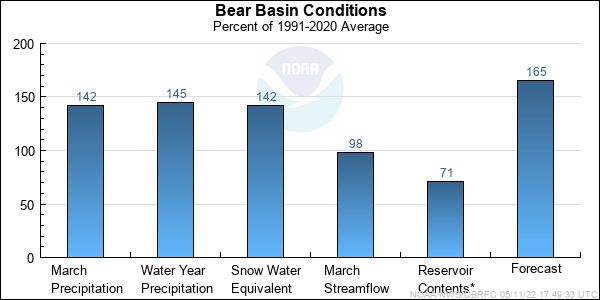
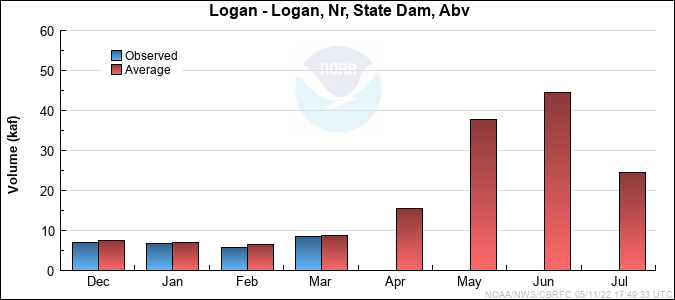
Bear Basin Conditions
The following conditions influenced this month's forecasts:
Precipitation:
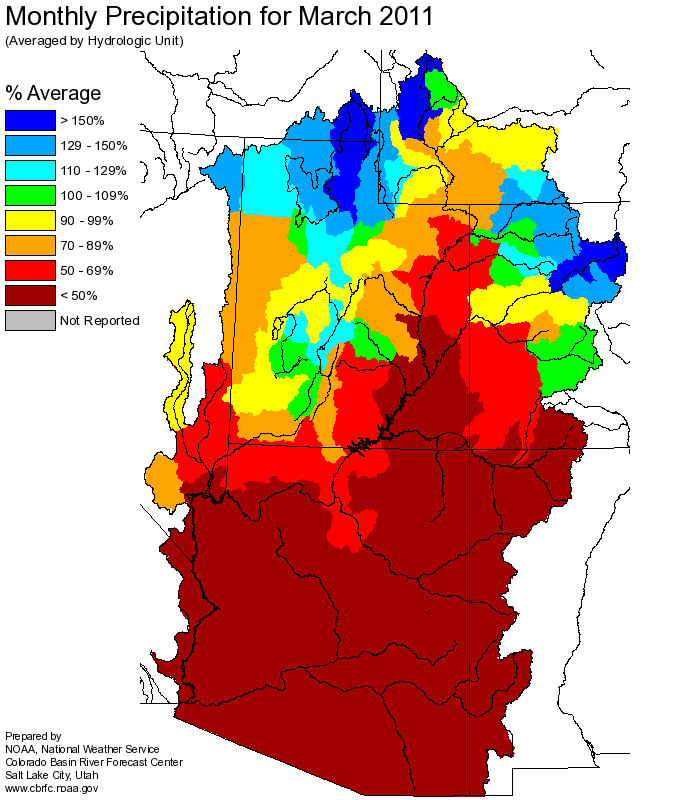
March
precipitation was 142 percent of average.
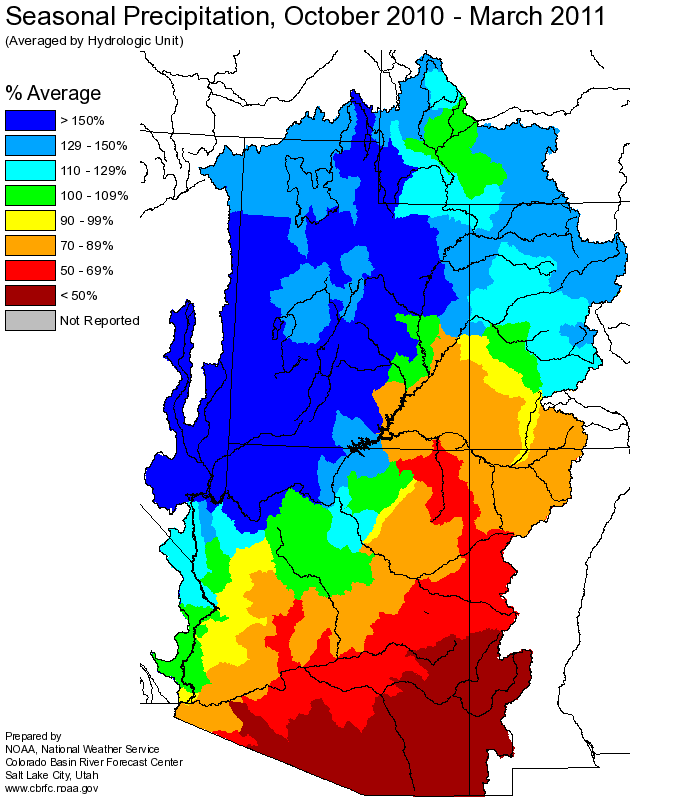
Seasonal, October through March
precipitation was 145 percent of average.
Streamflow:
Streamflow for the Logan River nr Logan last month were 98 percent of average. Bear at Stateline was estimated at 94% of average.
Snowpack:
April 1st snow water equivalent was 142 percent of average. Many SNOTEL sites in the basin have snow water equivalent values in the top 5% of their
historical records, with a few at record levels.
---Upper Bear River Basin
Snow Plot.
---Bear River Below Woodruff Narrows Reservoir
Snow Plot.
---Bear River Basin
Snow Plot.
Soil Moisture:
Modeled Soil
Moisture states were near average to above average for the northern Uinta Mountains heading into the winter.
Climate Forecasts:
Climate forecasts were not factored into the northern Utah forecasts because there is not a strong statistical correlation between
El Nino/La Nina conditions and winter precipitation.
Forecast Summary:
Monthly precipitation was much above average this month at 142 percent, seasonal accumulations remained much above average at 145 percent.
Current
April through July seasonal volume forecasts remain much above average
and range between 138 and 188 percent of average with a median value of 166 percent.
Many of these forecast volumes are in the top five historical observed volumes.
* Percent usable capacity, not percent average contents.
Click for multi-month Graph.
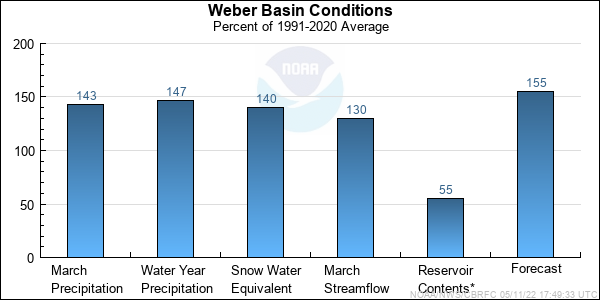
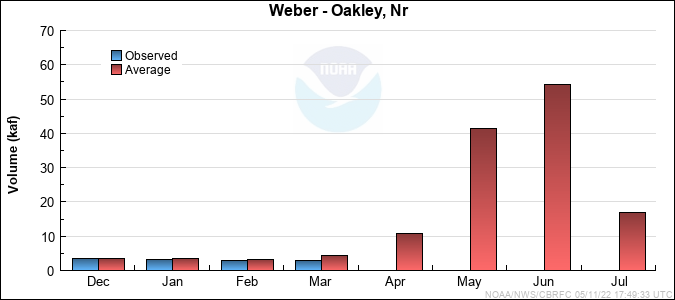
Weber Basin Conditions
The following conditions influenced this month's forecasts:
Precipitation:
March
precipitation was 143 percent of average.
Seasonal October through March
precipitation was 147 percent of
average.
Streamflow:
Streamflow above Rockport Reservoir last month were 130 percent of average. Many SNOTEL sites in the basin have snow water equivalent values in the top 5% of their
historical records, with a few at record levels.
Snowpack:
April 1st snow water equivalent was 140 percent of average.
---Weber River Basin
Snow Plot.
---Upper Weber River Basin
Snow Plot.
Soil Moisture:
Modeled Soil
Moisture states were mostly above normal in the western Uinta Mountains near the headwaters of the Weber heading into winter.
Climate Forecasts:
Climate forecasts were not factored into the northern Utah forecasts because there is not a strong correlation between
El Nino conditions and winter precipitation.
Forecast Summary:
Monthly precipitation was much above average at 142 percent. Seasonal accumulations remain much above average at 145 percent.
Current
April through July seasonal volume
forecasts remain much above average, and range between 141 and 176 percent of average with a median value of 157 percent.
Many of these forecast volumes are in the top five historical observed volumes.
* Percent usable capacity, not percent average contents.
Click for multi-month Graph.
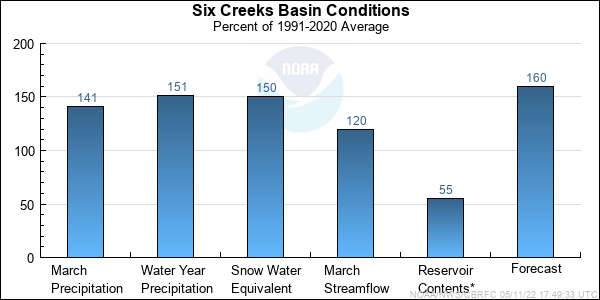
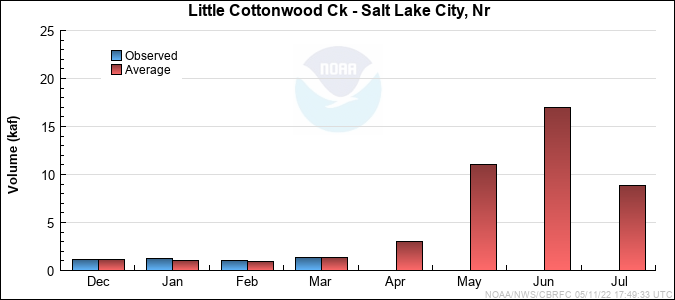
Six Creeks Basin Conditions
The following conditions influenced this month's forecasts:
Precipitation:
March
precipitation was 141 percent of average.
Seasonal October through March
precipitation was 151 percent
of average.
Streamflow:
Streamflows for Emigration Creek near Salt Lake City last month were 103 percent of average.
Snowpack:
April 1st snow water equivalent was 152 percent of average. Many SNOTEL sites in the basin have snow water equivalent values in the top 5% of their
historical records, with a few at record levels.
---Six Creeks River Basin
Snow Plot.
---Big and Little Cottonwood Canyons
Snow Plot.
Soil Moisture:
Modeled Soil
Moisture states were near average in the Six Creeks Basin heading into winter.
Climate Forecasts:
Climate forecasts were not factored into the northern Utah forecasts because there is not a strong correlation between
El Nino conditions and winter precipitation.
Forecast Summary:
Monthly precipitation was above average this month at 141 percent. Seasonal accumulations remained much above average at 151 pecent.
Current
April through July seasonal volume forecasts are much above average,
and range between 132 and 162 percent of average with a median value of 158 percent of average.
Many of these forecast volumes are in the top five historical observed volumes.
* Percent usable capacity, not percent average contents.
Click for multi-month Graph.
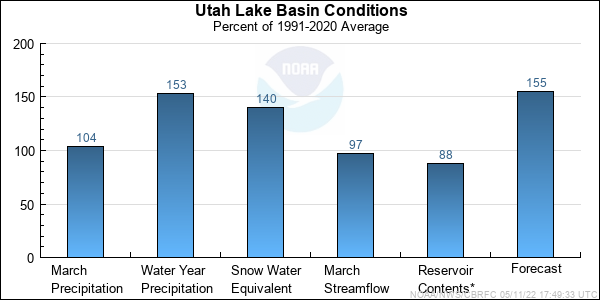
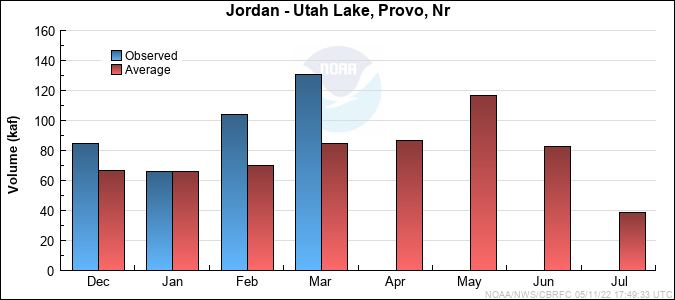
Utah Lake Basin Conditions
The following conditions influenced this month's forecasts:
Precipitation:
March
precipitation was 104 percent of average.
Seasonal October thought March
seasonal precipitation is 153 percent of average.
Streamflow:
Streamflow for the Provo at Woodland last month were 97 percent of average. Unregulated inflows to Utah Lake
were 154 percent of average.
Snowpack:
April 1st snow water equivalent was 142 percent of average. Many SNOTEL sites in the basin have snow water equivalent values in the top 5% of their
historical records, with a few at record levels.
---Provo River, Utah Lake Basin
Snow Plot.
Soil Moisture:
Modeled Soil
Moisture states were average to above average heading into the winter.
Climate Forecasts:
Climate forecasts were not factored into the northern Utah forecasts because there is not a strong correlation between
El Nino conditions and winter precipitation here.
Forecast Summary:
Monthly precipitation was average at 104 percent. Seasonal accumulations remained much above average at 153 percent. Current
April through July seasonal volume forecasts remain much above average
and range between 150 and 173 percent of average with a median value of 154 percent.
Many of these forecast volumes are in the top five historical observed volumes.
* Percent usable capacity, not percent average contents.
Click for multi-month Graph.
Differences between the full period forecasts and the residual forecasts may not exactly equal the actual observed volumes due to rounding conventions (see Definitions section).
Monthly Streamflows
Precipitation Maps
Hydrologist: B.Bernard
