Many of these forecast volumes are in the top five historical observed volumes.
The following conditions influenced this month's forecasts:
Precipitation:
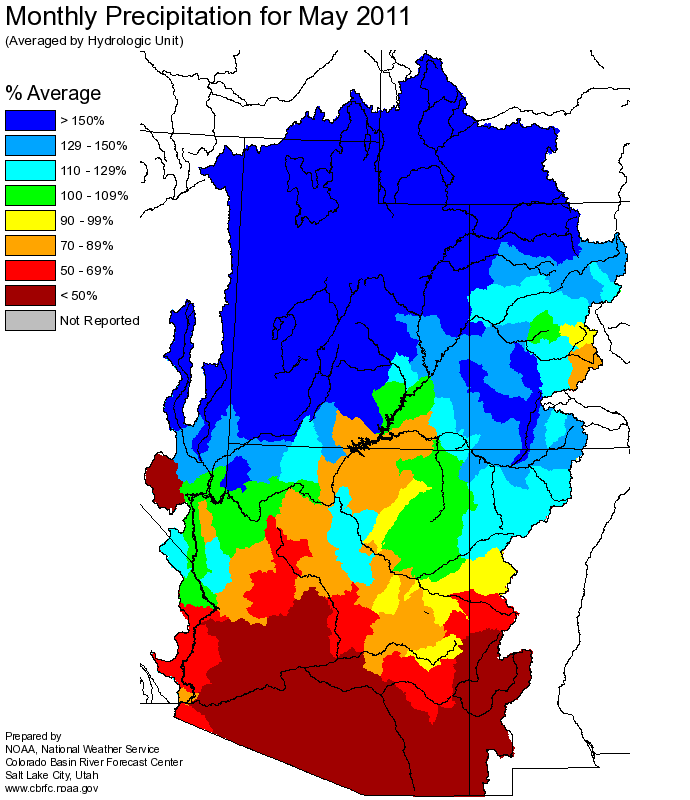
May
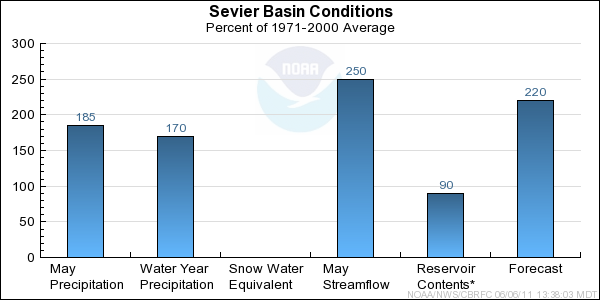
precipitation was 186 percent of average.
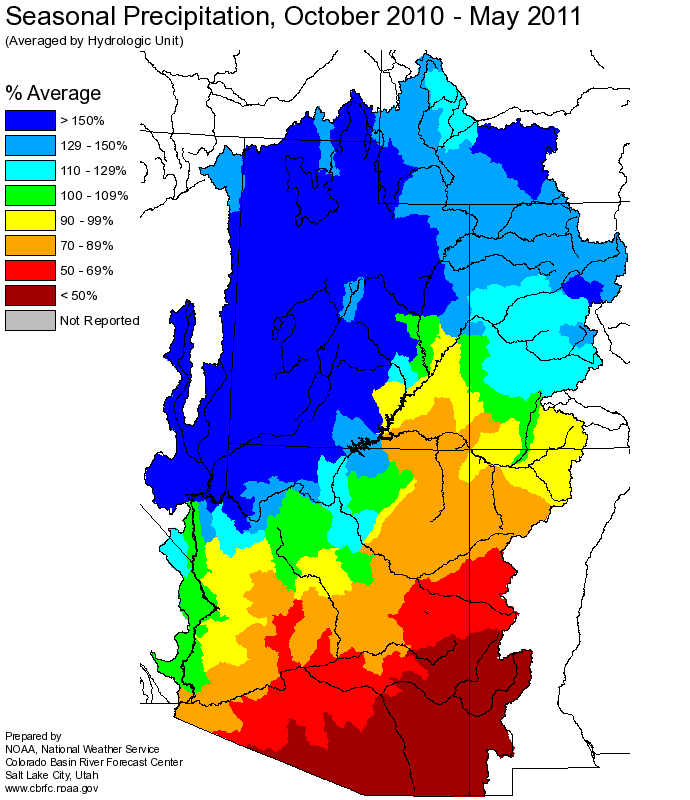
Seasonal October through May
precipitation was 171 percent of average.
In the upper basin the monthly precipitation was 179 percent and the seasonal precipitation was 187 percent of average.
Streamflow:
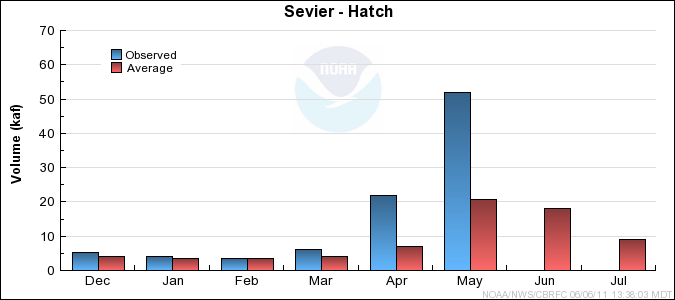
Streamflow for the Sevier River at Hatch was 250 percent of average.
Snowpack:
June 1st snow water equivalent was 383 percent of the daily average. As a percentage of the average seasonal peak snow (average max) the value was 70 percent of average. This value usually occurs in late March or early
April. Many SNOTEL sites in the basin have snow water equivalent values in the top 5% of their
historical records, with a few at record levels. * Analysis based on average may not provide a valid measure of conditions.
---Upper Sevier River Basin
Snow Plot.
---Sevier River Basin
Snow Plot.
---Lower Sevier River Basin
Snow Plot.
Soil Moisture:
Modeled Soil
Moisture states were much above average heading into the winter.
Climate Forecasts:
Generally climate scenarios like El Nino and La Nina have a weak to moderate effect in the Sevier River Basin. However because we a lack of good
statistical correlation, these events are not specifically factored into our water supply forecasts.
Forecast Summary:
May precipitation throughout the Sevier Basin was 186 percent of average. Seasonal October through May precipitation in the Sevier Basin was much above average at 171 percent.
Current
April through July
seasonal volume forecasts
range between 133 to 424 percent of average. The median forecast was 218 percent of average.
Some of these forecast volumes are in the top five historical observed volumes since record began.
As a reminder, forecasts for the EF Sevier, Sevier at Kingston, Piute Reservoir and Sevier near San Pitch Below Gunnison are all 'Regulated or Observed' flow forecasts rather
than 'Natural or Unregulated' forecasts which are corrected for all upstream diversions. Also because of this during large runoff years the regulated averages are exceeded in a significant
way and show fairly large numbers. The Sevier at Kingston is a case in point for 2011.
Differences between the full period forecasts and the residual forecasts may not exactly equal the actual observed volumes due to rounding conventions (see Definitions section).