Peak Forecast Help
Introduction
The peak flow forecast represents the maximum mean daily flow (the highest average flow for an entire day during the run
off season) at a point during the April through July period, unless otherwise noted. It does not represent the instantaneous
peak (the maximum flow at a single moment). In the case of smooth snowmelt regimes (hydrographs), it may be acceptable to
approximate one with the other. The Average Peak and Normal Time of Peak (defined as the average date of peak plus/minus
one standard deviation which should include approximately 70% of the peaks) for a given gage are all derived from
1981 through 2010 data whereas the Historic Peak is derived from the period of record, including the most recent
years, after reservoir regulation began.
A hydrograph including the current peak flow forecast in relationship to historical peaks and the April through
July stream flow can be obtained by clicking on an individual id in the "NWS ID" column. A short term stream flow forecast
is available by selecting "More Plot Options".
Flow extremes, Not Supply
Peak flow forecasts are fundamentally different than water supply volume forecasts. Although the watershed snowpack is a principal
component in both analyses, peak flows are not a supply question at all. Rather, peak flows characterize runoff extremes by predicting maximum
mean daily flow at a single point during the spring snowmelt season. This extreme is related to the water supply volume, but the relationship is not
direct or constant from year to year. As such, peak flow forecasts contain much more uncertainty than water supply volume forecasts.
Regulated vs. Natural Flows
An even more fundamental limitation is that peak forecasts describe regulated (actual or observed) in-stream flow well into the future,
something difficult to do considering the quantity and changing nature of diversions in the Colorado River and Great Basin watersheds. (Note:
supply forecasts deal with hypothetical "natural" flow - that which would have resulted in the absence of regulation). The Colorado Basin River
Forecast Center routinely forecasts regulated streamflow, but only for several days into the future. Further into the future the ability to forecast
reservoir regulation becomes more limited.
Different Uses and Users
Peak flow forecasts are used for different purposes than water supply volume forecasts. Users of these forecasts would include river
recreationists, flood control agencies, emergency service directors, wildlife managers and anyone interested in the combined effect of watershed
yield and human regulation on the actual (observed) in-stream maximum mean daily flows at a site.
Flood Flows
The National Weather Service defines flood flow as the flow at which damage to structures begins to occur. Over-bank flow may occur but
still be below the defined flood flow. Flood flows contained in this document change from year to year due to such channel processes as deposition
and scouring. Therefore, the flood flows that follow should only be applied to the current runoff season. It should also be noted that they are
instantaneous flows and not maximum mean daily flows. It should be noted that flood flows are not defined for all points. This does not mean flooding
can not occur.
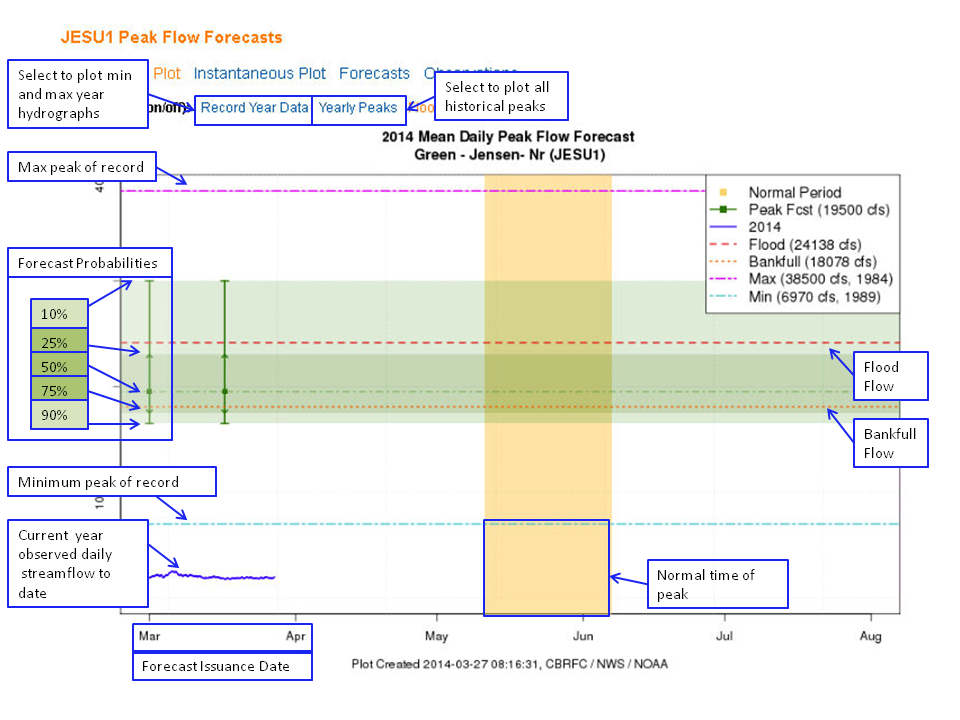
Forecast Probabilities
Peak flow forecasts are presented in terms of probabilities or, more specifically, exceedance probabilities.
The 50% exceedance level means there are equal chances of being below the value or above the value
(i.e., 50 chances out of 100 of being exceeded). The other exceedance probabilities associate the likelihood of exceeding other levels.
In general, a close bunching of the exceedance forecasts indicates low variability and that the user can have a high degree of
confidence in the forecast information. Conversely, a large spread in the exceedance forecasts indicates high variability.
Modeling Techniques
The peak flow forecasts that follow have been derived using a combination of (1) physically-based conceptual models and (2)
statistical regression models. The conceptual model is the National Weather Service River Forecasting System in the Ensemble
Streamflow Prediction (ESP) mode. Since the conceptual model requires reservoir operation plans for up to five months into the
future, ESP application is limited to basins where regulation is minimal (mostly in the headwater areas).
The farther downstream a forecast point is, the more likely it is that a statistical regression was used between natural snowmelt runoff
volume and the observed maximum mean daily flow to generate the forecast. Such an approach performs better when the correlation
between regulated and unregulated flow is strong and is constant from year to year.
We estimate, where possible, an instantaneous flow for each mean daily flow forecast. These instantaneous flows
are estimated from a historical regression analysis at each point. For more information view the
regression plots.
Notes
- Peak flow forecasts on the Green River below Flaming Gorge Reservoir are based on USBR planned regulation
- Peak flow foreacasts on the San Juan below Navajo Reservoir are based on USBR planned regulation
- Peak flow forecasts on the Gunnison below Crystal Reservoir are based on USBR planned regulation
- Peak flow forecasts account for CUWCD planned operations
- Peak flow forecasts on the Animas at Farmington are affected by the Durango Pumping Plant
- Runoff period March-June
- Peak flow forecasts are unregulated and do not account for upstream regulation. Forecast peaks will not be what is observed in the river. Peak statistics reflect regulated peaks and should not be compared to peak flow forecasts.
- Peak flow forecasts are regulated forecasts based on upstream diversions.
Peak Plots