May 1, 2013 Water Supply Forecast Discussion
The Colorado Basin River Forecast Center (CBRFC) geographic forecast area includes the Upper
Colorado River Basin, Lower Colorado River Basin, and Eastern Great Basin.
Seasonal Water Supply Forecasts:
Quick Summary:
Forecast volumes have significantly increased since last month on the Provo, Weber, Bear rivers, the head waters
of the Duchesne River, the White and Yampa Rivers and Upper Colorado River above Kremmling due to much higher than
normal precipitation in April.
Below to much below April through July runoff is forecast for the the San Juan, Gunnison, Sevier and lower
Green Rivers with mostly below normal conditions elsewhere.
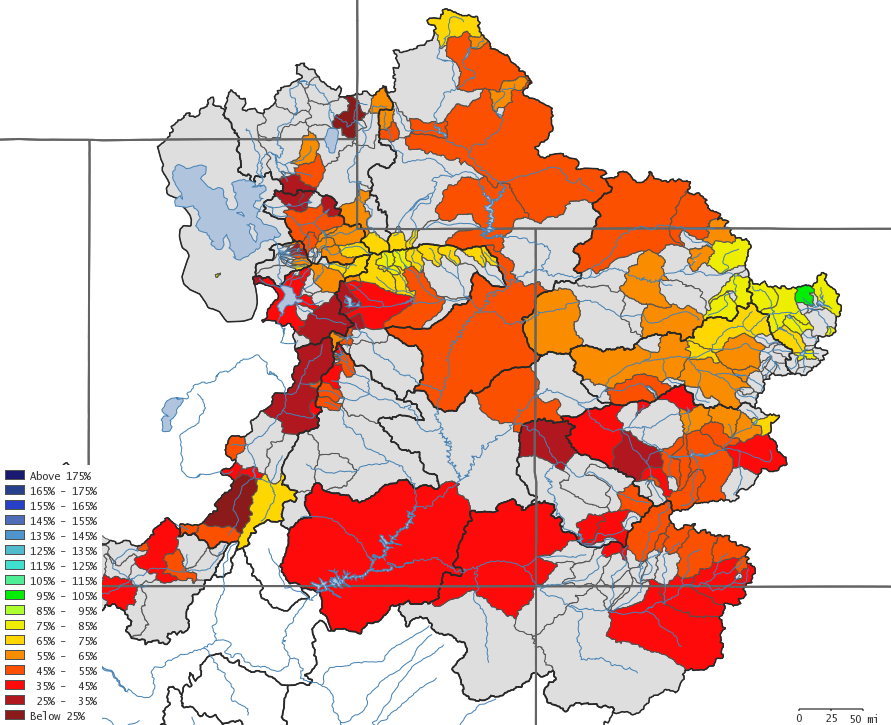
Image: River basin map for the April-July runoff forecast period. Forecasts are expressed as a percent of average.
Click here for specific site water supply forecasts
Water Supply Discussion
Weather Synopsis:
A mean trough of low pressure resulted in wet and cool weather conditions over the northern half of the CBRFC area
in April. The result was above average precipitation and below average temperatures for April over the northern
half of the CBRFC area, with near to above average temperatures and generally below average precipitation over the
southern half of the CBRFC area.
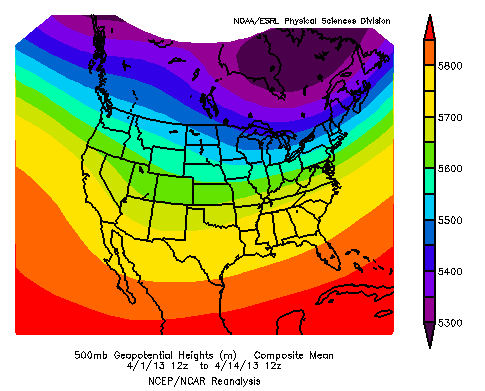
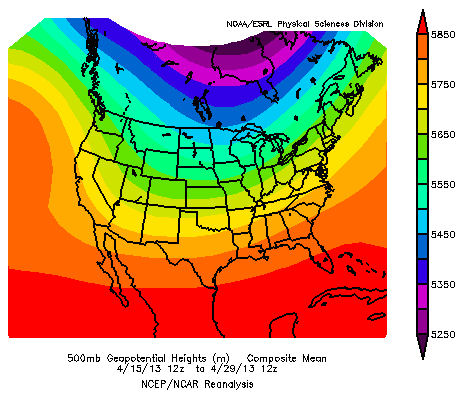
Image: Mean upper air pattern over the continental U.S. for April 2013 (first half of April left, second half right).
Precipitation and Temperature:
Although April precipitation was generally above average over the northern half of the CBRFC area, several locations
received in excess of 150 percent of the April average. These included the higher elevations in the Uinta Mountains that are part
of the Bear, Weber, and Duchesne River Basins. Headwater areas of the White and Yampa Rivers and Upper Colorado River also
received much above average precipitation. The Gunnison River Basin in Colorado and Upper Sevier River Basin headwaters in
Utah were the dividing line with areas to the south generally much drier, receiving less than 70 percent of average for April.
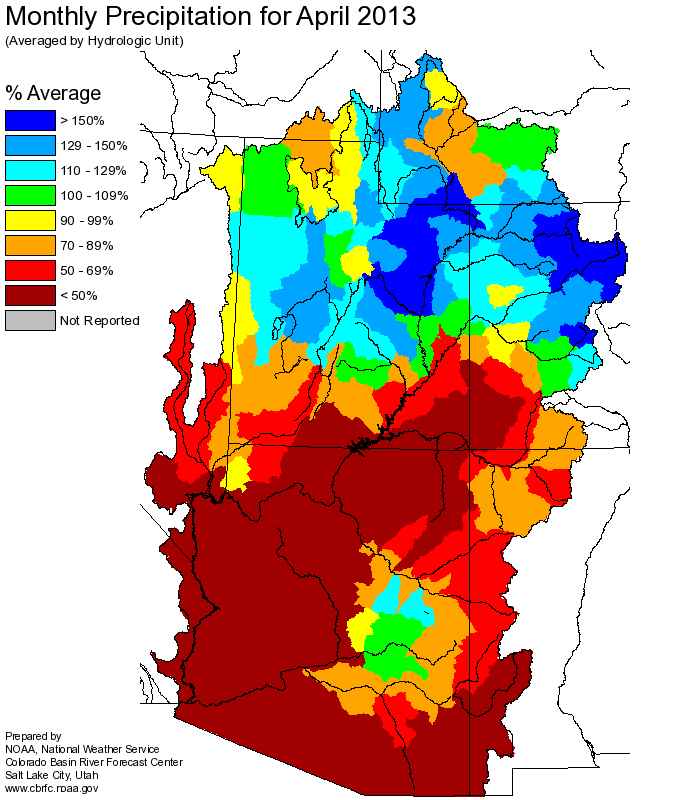
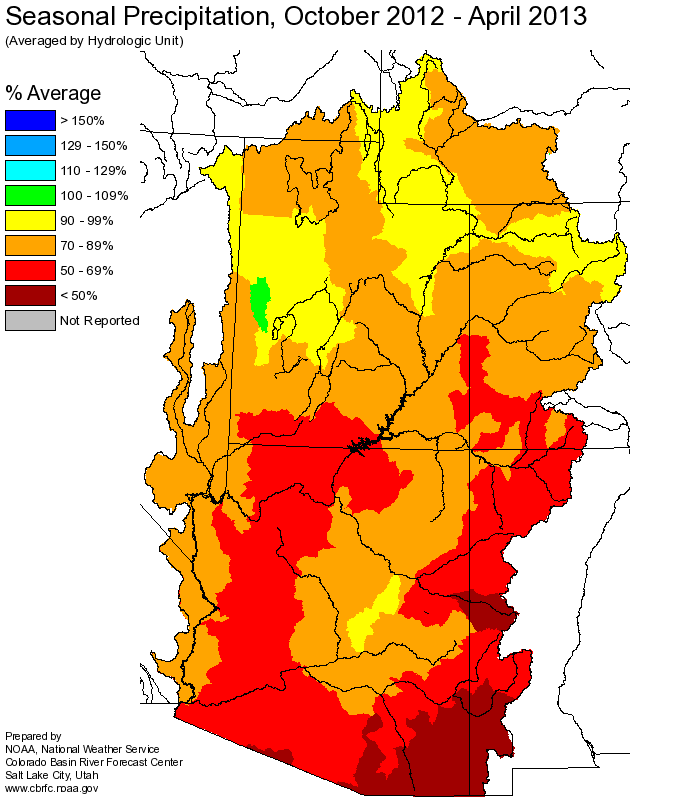
Image: April 2013 monthly precipitation as percent of average and October through April 2013 seasonal precipitation as percent of average.
The dividing line for temperatures in April was similar to that for precipitation. The northern half of the CBRFC area was
below average for the month, which delayed the snow melt in many of the higher elevation locations. Temperatures were near
or above average over the southern half of the CBRFC area as depicted in the image below. These conditions were quite
different than April of 2012 which was significantly warmer than April of 2013. The higher than average temperatures
in April of 2012 resulted in a large amount of snowmelt which helped in producing the low seasonal runoff volumes of
2012. The cooler April 2013 has retained the higher elevation snow and should improve runoff volumes this year.
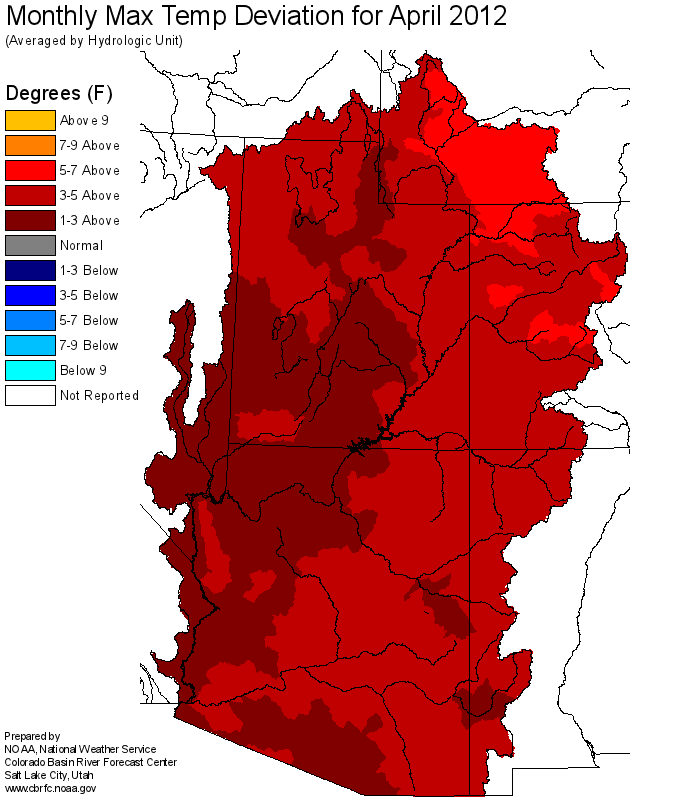
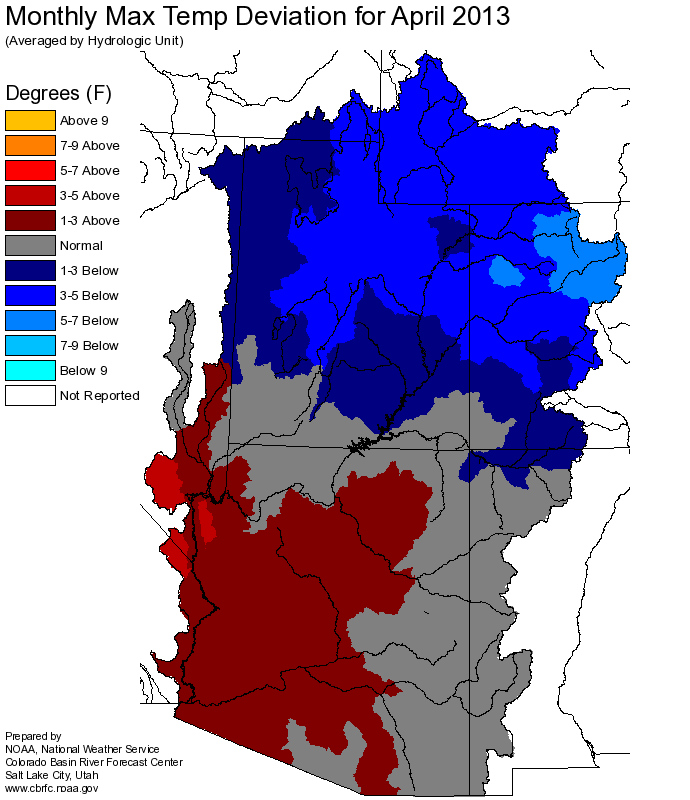
Image: April 2012 and April 2013 temperature departure from average.
Snowpack:
The snowpack in April improved dramatically in some basins including: The headwaters of the Bear, Weber and Provo
Rivers, the White and Yampa rivers, the headwaters of the Duchesne River and the upper Colorado River above
Kremmling. Lower percent of average snow was observed in the San Juan and Sevier River basins due to little
snowfall and higher than average rates of melt.
The map below is a display of Snow Water Equivalent (SWE) at SNOTEL sites as a percent of the 1981-2010 average.

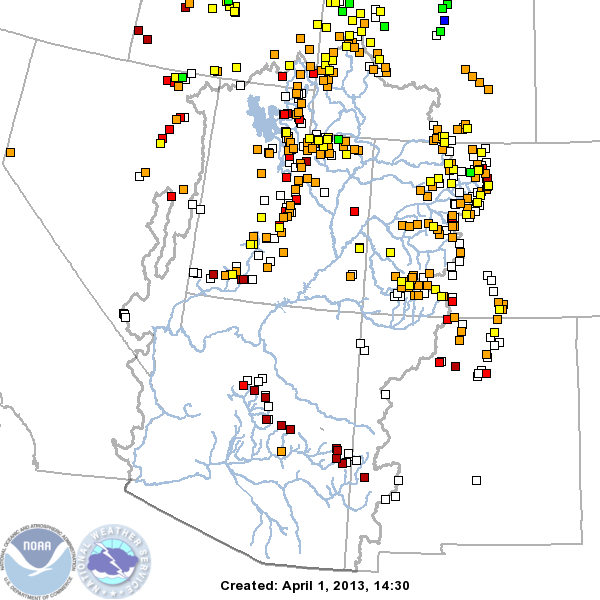
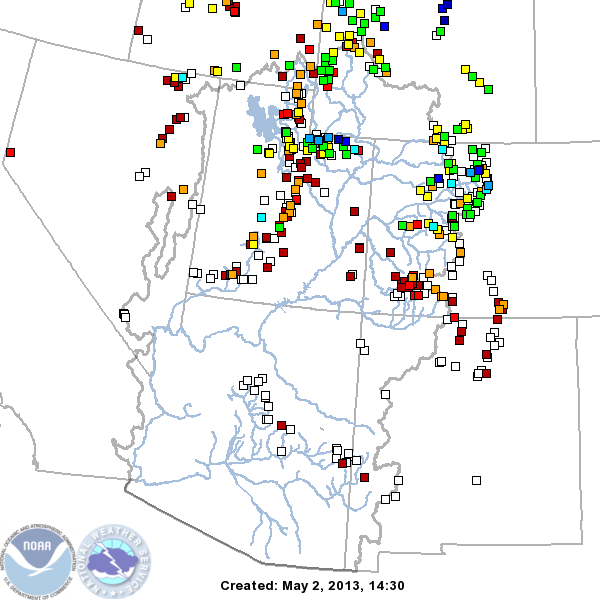
Image: CBRFC Snow Conditions Map as a percent of average for April 2013 and May 2013
Several SNOTEL sites that were recording values in the bottom 10 percent of their historical record on April 1st showed
improvement by early May. For many sites it was due to the fact the snow simply did not melt rapidly due to cooler
temperatures. However, in higher elevations of the Upper Colorado Headwaters and Yampa River Basin, and Duchesne, Weber,
Bear and Provo River basins of the Uinta Mountains the snowpack increased due to much higher than normal.
precipitation in April.

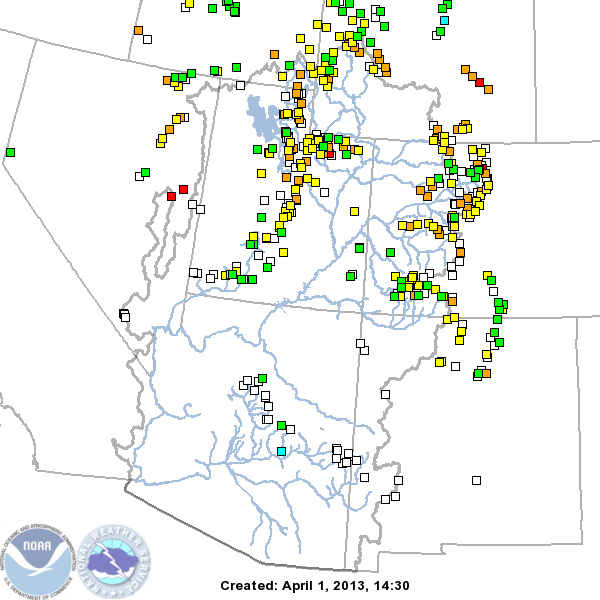
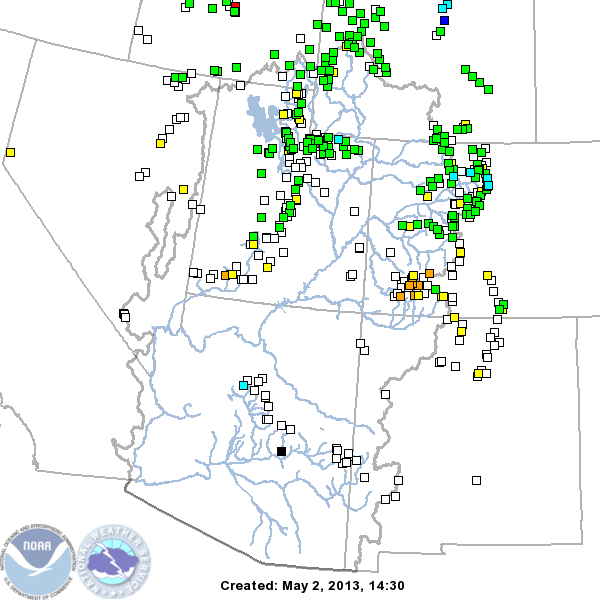
Image: CBRFC Snow Percentile Map - sites ranked based on historical record. Where sites changed color from yellow and
orange to green are where the snowpack was maintained or increased during April
Click here for river basin snow plots
Soil Moisture:
Soil moisture conditions in the higher elevation headwater areas are important entering the winter, prior to
snowfall, as it influences the efficiency of the snow melt runoff. Last fall, modeled soil moisture conditions
were below average throughout the upper and lower Colorado Basins. In northern Utah, modeled soil moisture was
closer to average in parts of the Bear, Weber, Provo, Six Creeks, and Duchesne Basins due to a late October storm
and high elevation rainfall. This is also true for some of the upper Green River Basin headwaters in Wyoming.
See the map below for a more detailed view.
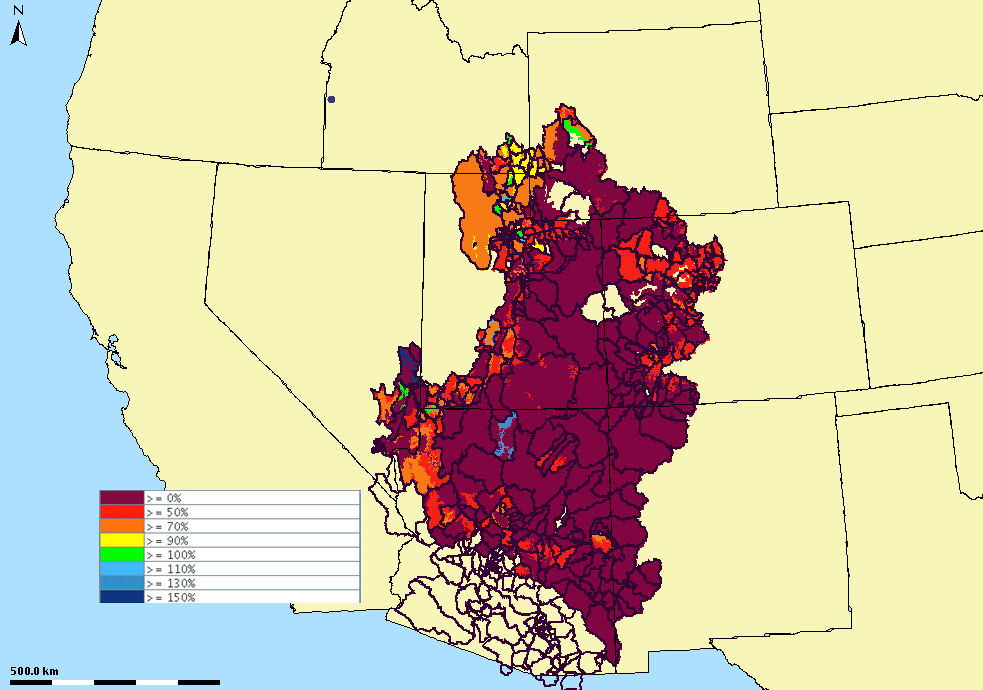
Image: Modeled soil moisture states (as a percent of average) on Dec 31 2012
Streamflow:
Streamflows generally remain below average over most of the CBRFC area reflecting low soil moisture conditions and
decreased melt due to lower than average temperatures. The exception to this is on the San Juan and Sevier Rivers
where higher than average rates of melt in April have resulted in near normal flows.
Climate Outlook:
The El Nino Southern Oscillation (ENSO) condition is considered neutral and this is expected to continue through
the northern hemisphere summer of 2013. The Climate Prediction Center indicates increased chances for below
average precipitation during the May through July period over most of CBRFC forecast area.
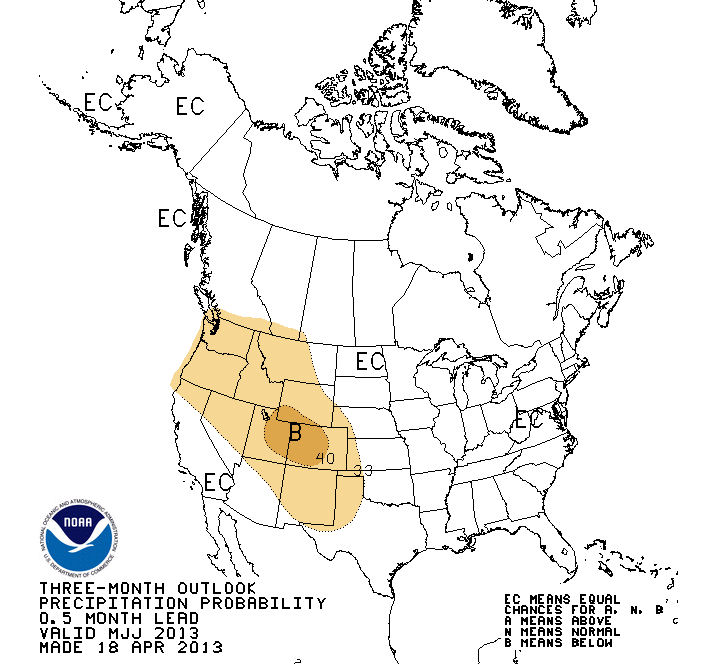
Image: Climate Prediction Center 3 month precipitation outlook
Conclusion:
The well above normal precipitation and lower than average temperatures have resulted in significantly
improved snowpack in many areas. These include: the Upper Colorado River above Kremmling,the Yampa and
White Rivers, the Provo, Weber and Bear Rivers and the headwaters of the Duchesne River. This has resulted
in signficantly higher runoff forecasts in these areas. However, the antecedent dry conditions
will continue to result in lower runoff than might be expected.
Much below average runoff is still expected for the San Juan River due to the much below average precipitation
in this area. Although the Gunnison, Roaring Fork and Eagle Rivers received above normal precipitation in April,
below normal runoff is still expected in these areas.
The forecast for the upper Green River above Flaming Gorge has improved due to higher than average precipitation
in April.
End Of Month Reservoir Content Tables
Green River Basin
Upper Colorado River Basin
San Juan River Basin
Great Salt Lake Basin
Sevier Basin
Virgin River Basin
Basin Conditons and Summary Graphics
Green River Basin
Upper Colorado River Basin
San Juan River Basin
Great Salt Lake Basin
Sevier River Basin
Virgin River Basin
Definitions
10% exceedance forecast: Given the current hydrometeorological conditions, i.e current snowpack, soil moisture and streamflow, the volume that has a 10% chance of being exceeded. Previously referred to as "Reasonable Maximum Forecast".
50% exceedance forecast: Given the current hydrometeorological conditions, i.e current snowpack, soil moisture and streamflow, the volume that has a 50% chance of being exceeded. Previously referred to as "Most Probable Forecast".
90% exceedance forecast: Given the current hydrometeorological conditions, i.e current snowpack, soil moisture and streamflow, the volume that has a 90% chance of being exceeded. Previously referred to as "Reasonable Minimum Forecast".
Acre-Foot (af):
The volume equal to one acre covered one foot deep (43,560 cubic feet). See kaf below.
Average:
The arithmetic mean. The sum of the values divided by the number of values. Values from 1981-2010 are used for this publication.
Categories:
Much Above Average=Greater than 130%, Above Average=111-130%, Near Average=90-110%, Below Average=70-89%, Much Below Average=Less than 70%.
CBRFC:
Colorado Basin River Forecast Center.
Forecast Period:
The period from April 1 through July 31, unless otherwise noted.
kaf:
Thousand Acre-Feet. See Acre-Foot above.
Inflow:
The volume of water that flows into a reservoir or lake.
Median:
The middle value of an ordered set of values. Half of the values are higher and half of the values are lower. When the set contains an even number of values the median is the average of the two middle numbers.
NOAA:
National Oceanic and Atomospheric Administration.
NWS:
National Weather Service.
Rounding Conventions:
| Range | | Round to |
| 0-1.99 | | 0.01 |
| 2.0-19.9 | | 0.1 |
| 20-199 | | 1.0 |
| 200-999 | | 5.0 |
| 1000+ | | 3 significant digits |
Streamflow:
The volume of water that flows past a specific stream site.
Water Year:
The 12-month period, October 1 through September 30. The water year is designated by the calendar year in which it ends. Thus, the year ending September 30, 2008, is called the "2008 water year."
Additional Information
Water supply forecasts take into consideration present hydrometeorological conditions and use
average basin temperatures and precipitation for the forecast period. As the forecast season progresses,
a greater portion of the future hydrologic and climatic uncertainty becomes known and
monthly forecasts become more accurate. For more information on the tools we use, consult
Water Supply Forecasting Tools.
Volume forecasts represent adjusted flows; that is, observed flows with upstream water use
taken into account. Adjusted flows will closely approximate natural or unimpaired flows.
However, not all upstream diversions or impoundments are measured or quantifiable. For specific
adjustments used with each forecast point, consult the
Guide to Water Supply Forecasting.
The Water Supply Outlook is issued monthly January through May by the Colorado Basin River
Forecast Center. It represents a coordinated effort between the
National Weather Service, Natural Resources Conservation Service, Bureau of Reclamation, U.S.
Geological Survey and local water district managers.
Note: Data used in this report are provisional and are subject to revision.
For more information, or to be included on the mailing list, please contact:
Colorado Basin River Forecast Center
2242 W North Temple
Salt Lake City, UT 84116
(801) 524-5130
www.cbrfc.noaa.gov